1. Executive Summary: The Price-vs-Cost Paradox in Abrasive Procurement
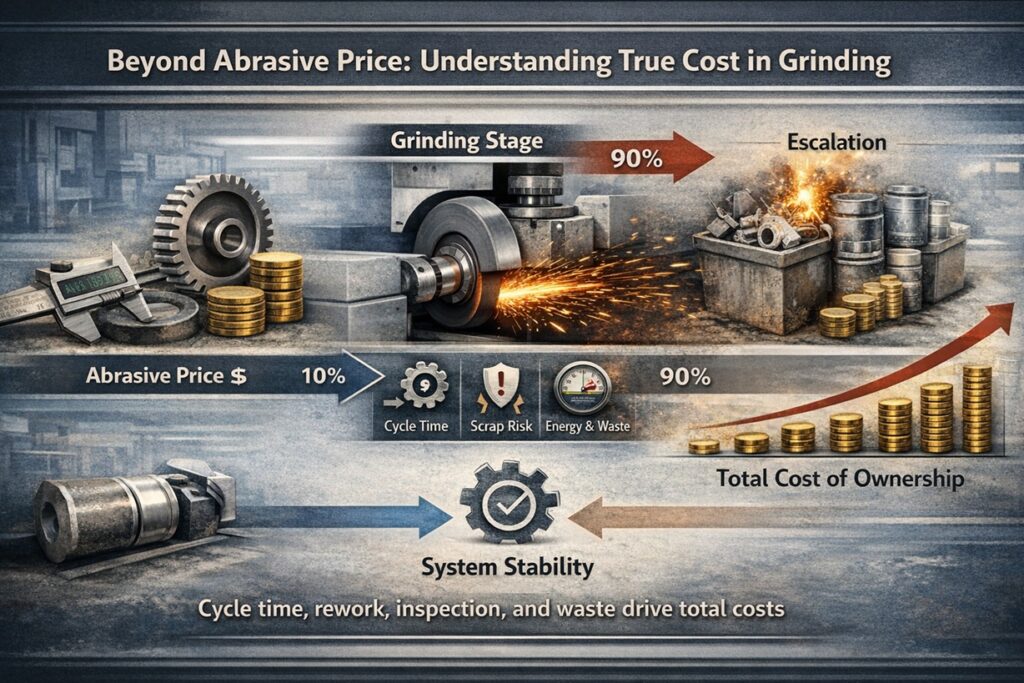
In the high-stakes environment of precision manufacturing, the procurement of grinding wheels is frequently compromised by a fundamental misunderstanding of “value.” While purchasing departments often focus on the unit price (Punit) as a primary KPI, this narrow focus ignores the Deterministic Mechanism by which an abrasive tool dictates the total cost per part (Cp). In reality, the purchase price of a wheel typically represents less than 10% of the total manufacturing cost, while its performance governs the remaining 90% through cycle time, scrap rates, and energy intensity.
The Fallacy of the Consumable Unit Price
The “Price-vs-Cost Paradox” arises when a low-cost abrasive tool, characterized by poor grain retention or unstable self-sharpening properties, necessitates an aggressive Dressing Frequency. Each time a wheel is dressed, it is not only the abrasive material that is lost; the machine enters a state of non-productive downtime, and the Specific Grinding Energy (us) fluctuates, risking the integrity of the workpiece. A 15% reduction in wheel price is often negated by a mere 2% increase in cycle time (Tc), leading to an exponential decline in Net Salable Yield (Ynet).
Quantifying the Hidden Cost Mechanism
To achieve economic transparency, manufacturers must transition to a Total Cost of Ownership (TCO) framework. This framework treats the grinding wheel not as a disposable commodity, but as a strategic Mechanism for profit maximization. The relationship between the tool and the financial outcome is governed by the System Stability Variable. When a wheel maintains its profile longer and cuts with lower thermal flux, it reduces the burden on auxiliary cooling systems and eliminates the need for unplanned secondary operations.
CTCO = (Punit / Nparts) + Σ (Tcycle · Rm) + Cquality
Equation 1.1: Simplified TCO Mechanism per Workpiece
Where Nparts is the total yield over the wheel’s life, Rm is the machine’s hourly overhead rate, and Cquality represents the risk-adjusted cost of rework and scrap. As Rm continues to rise due to energy prices and labor scarcity, the Mechanism of the process becomes the dominant factor in global competitiveness. This article will provide a practical framework to dissect these drivers, moving from “low-bid” procurement to a “high-yield” strategic equilibrium.
The TCO Axiom: “The cheapest grinding wheel is often the most expensive component in the factory. True manufacturing ROI is realized when the Mechanism of the tool is aligned with the economic goal of maximum net salable yield.”
2. The TCO Calculation Framework: Beyond the Invoice
Calculating the true Total Cost of Ownership (TCO) in grinding operations requires a multidimensional approach that extends far beyond consumable expenses. TCO is not merely the purchase price of a single wheel; it is the economic summation of every Mechanism triggered from the moment the tool is mounted until the final part is dispatched. To quantify this, manufacturers must establish a Cost-per-Part (Cp) model that integrates hourly machine rates with the wheel’s lifecycle performance.
The Components of the TCO Mechanism
A standard TCO framework consists of three core variables: First, Direct Tooling Costs (unit price and usable life); second, Production Efficiency Costs (cycle time and dressing downtime); and third, Quality and Energy Overhead. The most significant ROI when adopting high-performance abrasives is typically found in the extension of the dressing interval (Idress), which directly enhances the net utilization rate of the grinding cell.
Cp = ( Pw / Nlife ) + [ ( Tc + Td / Nd ) · ( Rm / 3600 ) ]
Equation 2.1: Deterministic Cost-per-Part Mechanism
In Equation 2.1, Pw represents the wheel price and Nlife is the total number of parts produced over the tool’s entire lifespan. Tc is the net grinding cycle time, Td is the time required for dressing, and Nd is the number of parts produced per dressing cycle. As the hourly machine rate (Rm) increases, the influence of Processing Efficiency (Tc, Td) on TCO grows exponentially compared to the initial tooling price.
The Hidden Impact of the Dressing Mechanism
Dressing is not merely a geometric correction; it is a fundamental reset of the process’s Thermal Stability. Lower-grade wheels often exhibit irregular grain shed, necessitating frequent dressing that prematurely depletes the wheel and accelerates dresser wear. Conversely, high-performance wheels utilize superior Retention Strength to maintain a stable Q’w (specific removal rate). Reducing dressing frequency by even 30% can recover thousands of dollars in annual productive capacity.
The Calculation Axiom: “Procurement without data is mere speculation. By using a Cp model to translate mechanical performance into financial value, the Mechanism of process optimization is finally realized.”
3. Impact of Surface Integrity on ROI: The Cost of Quality Failure
In the value chain of precision manufacturing, failure in Surface Integrity represents a financial catastrophe of significant proportions. Because grinding is typically the final operation in the production sequence, any defect introduced at this stage annihilates the cumulative value added during all preceding processes—including casting, forging, pre-machining, and heat treatment. From a TCO perspective, ROI is not merely determined by how fast a tool can cut, but by its ability to maintain a Stable Quality Mechanism that suppresses scrap costs.
The Mechanism of Thermal Damage and Economic Loss
The most critical quality failure, Grinding Burn, occurs when the tool’s cutting efficiency degrades, causing the Thermal Flux to exceed the workpiece’s metallurgical threshold. This triggers a transformation in the microstructure or introduces residual tensile stresses, drastically reducing the fatigue life of the component. Sub-optimal wheels reinforce a Rubbing Mechanism rather than a cutting one, creating “latent defects” that may not be visible to the naked eye but pose massive long-term liability and recall risks.
ROIquality = (Σ Vadded · ΔYnet) / Itooling
Equation 3.1: Quality-Adjusted ROI Mechanism
In Equation 3.1, Vadded represents the cumulative value added to the part up to the grinding stage, and ΔYnet is the increase in net salable yield achieved by upgrading to a high-performance abrasive. Even if a premium wheel costs twice as much as a standard alternative (Itooling), increasing the yield by even a small margin in high-value sectors—such as aerospace turbine blades or EV transmission gears—results in an immediate recovery of the tooling investment by orders of magnitude.
The Quality Axiom: “In precision grinding, stability is the ultimate form of economy. A tool that eliminates one scrapped workpiece per week pays for itself more effectively than a tool that reduces cycle time by 10% but introduces variability into the Mechanism.”
4. Secondary Processing Escalation: The Hidden Profit Killer
A frequent oversight in TCO analysis is treating the grinding stage as an isolated cost center. In reality, the output quality of the grinding process determines the Economic Load on all subsequent finishing steps, such as super-finishing, lapping, or polishing. When a sub-optimal grinding wheel fails to achieve the target Ra (average roughness) or leaves behind a “smear” layer of deformed metal, it forces the escalation of secondary processing times, significantly increasing the total manufacturing cost.
The Mechanism of Process Sequence Optimization
High-performance abrasives utilize a Self-Sharpening Mechanism that ensures consistent grain friability. This allows for a much tighter control over the peak-to-valley heights (Rz) on the workpiece surface. By achieving a “near-mirror” finish during the primary grinding pass, manufacturers can often eliminate entire secondary operations or reduce the time required for super-finishing by up to 50%. This creates a massive ROI through the reduction of labor, specialized finishing consumables, and floor space requirements.
Ctotal = Cgrind + Σ ( Tsec · Rsec )
Equation 4.1: Total Finishing Cost Mechanism
In Equation 4.1, Tsec represents the time spent on secondary processes and Rsec is the respective hourly rate for those operations. Even a 10% increase in grinding wheel price is negligible if it yields a 20% reduction in Tsec. In high-precision industries, the cost of specialized polishing media and the high hourly rate of finishing technicians often dwarf the cost of the abrasive tool itself.
The Synergy Axiom: “The grinding wheel is the gatekeeper of the finishing department. An investment in superior abrasive Mechanisms is effectively an investment in the streamlining of the entire downstream manufacturing flow.”
5. The Energy and Environmental Surcharge: Sustainability as ROI
In the modern manufacturing landscape, energy consumption and carbon emissions are no longer externalized factors; they are direct components of the TCO. The Grinding Mechanism is inherently energy-intensive, with a significant portion of spindle power being converted into heat. Sub-optimal wheels with poor grain retention or dull cutting edges increase the Specific Grinding Energy (ec), requiring more kilowatts to remove the same volume of material.
The Mechanism of Energy Dissipation
High-efficiency abrasives reduce the Coefficient of Friction at the grinding zone. By maintaining sharp cutting points through controlled micro-fracturing, these wheels ensure that power is utilized for chip formation rather than being wasted on plowing or rubbing. This not only lowers the immediate electricity bill but also reduces the thermal load on the coolant system, further decreasing the energy required for fluid refrigeration and filtration.
Etotal = ∫ ( Pspindle + Pcoolant + Paux ) dt
Equation 5.1: Cumulative Process Energy Mechanism
Beyond direct energy, the Environmental Surcharge includes the cost of coolant disposal and wheel waste. High-performance wheels that offer extended dressing intervals and longer life cycles (Nlife) generate significantly less landfill waste. Furthermore, because they generate less heat, the evaporation rate of expensive chemical coolants is reduced, leading to a lower Coolant Replenishment Rate and reduced hazardous waste handling costs.
The Green Axiom: “In precision engineering, a more efficient Mechanism is naturally a more sustainable one. Reducing the energy required for material removal is the most direct path to aligning manufacturing ROI with global ESG goals.”
6. Conclusion: The Strategic Integration of TCO
The journey from a “Price-First” to a “Value-First” procurement model is not merely a shift in accounting; it is a fundamental reconfiguration of the Manufacturing Mechanism. As demonstrated throughout this report, the initial invoice price of a grinding wheel typically represents less than 10% of the total manufacturing cost of the finished part. The remaining 90% is dictated by cycle times, dressing downtime, scrap rates, and secondary processing requirements.
Summary of the TCO Advantage
High-performance abrasives act as a catalyst for overall process stability. By ensuring Thermal Integrity and geometric precision, these tools eliminate the hidden “friction” in the production flow. The ROItotal is achieved not by saving a few dollars on the tool itself, but by unlocking the latent productive capacity of the machine tool—a multi-million dollar asset whose hourly rate is the true driver of profitability.
Final Strategic Recommendations
- ✓
Shift to Cost-per-Part Metrics: Transition from monitoring “price per wheel” to a standardized Cp model that includes machine overhead and dressing time. - ✓
Prioritize Process Stability: Value tools that offer consistent performance over their entire life cycle (Nlife) to minimize the risk of “latent burns” and unexpected scrap. - ✓
Evaluate Downstream Savings: Quantify the reduction in secondary polishing and quality inspection costs when selecting primary grinding tools. - ✓
Incorporate ESG Factors: Recognize that lower specific grinding energy (ec) and reduced hazardous waste disposal are direct contributors to long-term profitability.
“Profitability in precision engineering is not found in the cheapness of the tool, but in the perfection of the Mechanism. The lowest cost of production is always achieved by the highest performing process.”
References & Technical Resources
Primary Engineering References
- • Malkin, S., & Guo, C. (2008). Grinding Technology: Theory and Applications of Machining with Abrasives. Industrial Press. (Core reference for thermal damage mechanisms and specific energy ec).
- • Rowe, W. B. (2014). Principles of Modern Grinding Technology. William Andrew. (Analysis of surface integrity, geometric stability, and dressing mechanisms).
- • Klocke, F. (2011). Manufacturing Processes 2: Grinding, Honing, Lapping. Springer Science. (Technical modeling of secondary processing escalation and finishing costs).
- • Tawakoli, T. (1993). High Efficiency Deep Grinding. VDI Verlag. (Foundational work on maximizing material removal rates while maintaining quality ROI).
Internal Technical Deep-Dive
For further exploration of the strategic TCO and mechanical principles discussed in this report, please refer to the following internal technical modules:
QUALITY & ROI:
Thermal Damage vs Scrap Cost: Quantifying the Real Cost of Grinding Burn
PROCESS STABILITY:
Grinding Process Stability: Why Stable Processes Reduce Total Manufacturing Cost
REWORK ANALYSIS:
Rework and Secondary Processing Cost Caused by Poor Grinding Conditions
ENERGY EFFICIENCY:
Grinding Energy Consumption: How Process Parameters Affect Power and Cost
TOLERANCE IMPACT:
Precision Grinding Tolerances: When Tighter Specs Multiply Costs