1. The Blueprint Fallacy: How Micrometric Lines Paralyze Shop Floor Productivity
In modern precision manufacturing, a dangerous disconnect persists between the design studio and the production floor. The technical drawing, intended to be a framework for structural integrity, frequently becomes an accidental instrument of economic devastation. This Phenomenon, which we define as the Blueprint Fallacy, occurs when a designer tightens geometric tolerances and surface roughness (Ra) parameters without a quantified functional justification. This Deterministic Decision locks in highly restrictive manufacturing Mechanisms, forcing the shop floor to sacrifice its core asset utilization and throughput for non-functional aesthetics.
The Psychological Buffer and Over-Engineering Habits
Designers frequently employ tight tolerances as a psychological safety buffer to mitigate engineering uncertainties. By specifying an arbitrary finish, such as Ra ≤ 0.1 μm instead of a functionally sufficient Ra ≤ 0.4 μm, the designer believes they are protecting the assembly’s Quality Stability. In reality, this lack of Geometric Fidelity to actual mechanical needs acts as a massive Hidden Constraint. The interaction between unnecessary precision and equipment capacity creates a compounding bottleneck that devalues the Residual Value of the manufacturing cell.
The Cycle Time Escalation Model
Ttotal = Tcut × ( Ra,functional / Ra,specified )α + Tnon-productive
Where α > 1.5 represents the empirical penalty exponent for fine grit interaction. As the specified Ra approaches the limits of machine Anatomy, cycle times expand non-linearly, destroying Operational Efficiency.
The Productivity Bottleneck: Exponential Velocity Penalties
When an over-specified drawing reaches the shop floor, the grinding Mechanism must be throttled to prevent thermal breakdown. To generate a micro-finish that complies with a flawed Blueprint, the Material Removal Rate (MRR) must be reduced dramatically. This creates an immediate velocity penalty: table speeds are lowered, depth of cut is minimized, and extended spark-out passes are programmed. The system’s Behavior shifts from efficient material shearing to redundant friction, crippling the plant’s overall volume output and driving the Total Manufacturing Cost to unsustainable levels.
Table 1.1: Cost and Time Divergence Across Process Thresholds
| Process Selection | Surface Roughness Target (Ra) | Relative Cycle Time Impact | Economic Feasibility Status |
|---|---|---|---|
| High-Feed Turning | 0.8 – 1.6 μm | 1.0× (Baseline) | Highly Optimized |
| Standard Grinding | 0.4 μm | 2.5× | Functionally Justified |
| Over-Specified Grinding | ≤ 0.1 μm | 7.8× | Severe Productivity Sunk |
Case Study 1: The Non-Assembled Clearance Feature Failure
A striking example of this Phenomenon was observed in the production of a heavy-duty hydraulic manifold spacer block. The component’s outer relief face served purely as a clearance zone with no mating interfaces, seals, or structural fatigue loads. However, the design team applied a global drawing block tolerance specifying an Ra ≤ 0.15 μm finish across all surfaces.
This arbitrary specification forced the shop floor to route the part away from high-efficiency CNC milling centers directly into a precision reciprocating surface grinding line. The required cycle time per component escalated from a 4-minute single-pass machining step to a complex 22-minute multi-stage grinding sequence. A Deterministic Assessment of the line confirmed that this over-engineering mistake increased total processing time by 450% and depleted the machine’s Residual Value, while generating zero functional improvement to the hydraulic system’s operation.
2. Abuse of the Grinding Wheel: The Dressing Overload Trap and Downtime Explosion
When severe surface tolerances enter the production cycle, the primary burden of execution shifts directly onto the abrasive tool. To fulfill the strict requirements of an over-engineered Blueprint, operators are forced into a defensive strategy that inflicts severe damage on asset lifecycle metrics. The grinding wheel’s cutting Mechanism must be kept in a perpetual state of artificial sharpness, triggering a destructive pattern known as the Dressing Overload Trap. This approach attempts to bypass physical limits but ultimately destroys the tool’s Residual Value and causes an immediate drop in overall plant productivity.
The Dressing Overload Trap: Artificially Shifting Wheel Lifecycles
Under normal operating parameters, a grinding wheel relies on its natural self-sharpening Behavior, where micro-fracturing of worn grains continuously exposes fresh, sharp cutting edges. However, when a design demands a surface finish that leaves no room for standard geometric variation, this natural progression becomes a liability. Even minor grain flattening (attritious wear) causes friction to spike, resulting in instant out-of-tolerance parts. To counter this, operators use aggressive mechanical dressing actions to strip away healthy abrasive layers before the wheel can dull, replacing a balanced wear pattern with massive tool depletion.
Wheel Lifespan Degradation Model
Lwheel = ( Vconsumable / tdress ) × ( 1 – Ncycles / Nthreshold )
Where Vconsumable represents the total dressable volume of the wheel, and tdress is the dressing depth per pass. As the frequency of cycles increases to maintain cosmetic targets, tool life drops linearly while non-cutting intervals multiply.
Accumulating Non-Productive Time and OEE Collapse
The systematic destruction of the grinding wheel has an immediate negative impact on Overall Equipment Effectiveness (OEE). Frequent dressing cycles directly eat into active machining time. The automated dresser must repeatedly traverse the wheel, a process that requires deceleration, positioning, execution, and subsequent spark-out passes to stabilize the new profile. This Hidden Constraint means that high-capital machinery spends a large portion of its operational life moving air rather than cutting metal. This dynamic ruins Economic Feasibility by turning an automated production cell into a high-maintenance bottleneck.
Table 2.1: Dressing Frequency vs. Operational Asset Metrics
| Dressing Mode | Interval Frequency | Abrasive Consumable Cost | OEE Availability Level |
|---|---|---|---|
| Standard (Functional) | Every 50 Parts | Optimized Baseline | 85% – 90% (World Class) |
| Frequent (Tighter Specs) | Every 10 Parts | 3.5× Increase | 60% – 65% (Marginal) |
| Extreme (Over-Specified) | Every 1 Part | 12.0× Increase | < 40% (Process Failure) |
Case Study 2: The Spool Valve Circularity Disaster
The severe cost of this breakdown was documented during the processing of high-precision hydraulic spool valves. The design engineer specified a strict roundness and cylindrical tolerance threshold of 0.5 μm along the entire 150 mm sealing land, assuming this would prevent micro-leakage. This tight limit exceeded the machine’s natural thermal Anatomy and structural stiffness under continuous load.
To achieve this geometric target, the production team adjusted the grinding sequence to dress the vitrified CBN wheel after every single component pass. This constant dressing quickly consumed the expensive superabrasive wheel layer, slashing its expected production life from six months down to just eighteen days. Furthermore, the constant diamond dresser contact caused rapid wear on the tooling mechanism, injecting erratic errors into the system’s Integration paths. A Deterministic Assessment revealed that the line’s OEE plummeted to 38%. The operation wasted massive capital on consumable tooling and maintenance hours, all to deliver a cosmetic roundness metric that yielded no measurable improvement in the completed valve assembly’s hydraulic performance.
3. The Economics of “Hidden Scrap”: Process Capability Collapse and Post-Process Value Sunk
Pushing grinding limits to meet arbitrary surface requirements triggers a severe problem: the collapse of statistical process capability (Cpk). When a design forces tolerances into the range of minor machine vibrations and thermal fluctuations, the process window narrows to a critical degree. This structural shift destroys Quality Stability, turning a stable production line into a high-risk operation characterized by “Hidden Scrap”—where parts appear perfect but fail to meet unrealistic microscopic criteria.
The Statistical Mechanism of Cpk Erosion
Process capability relies on a balanced relationship between design tolerances and natural manufacturing variations. When an over-engineered Blueprint tightens these limits unnecessarily, the upper and lower specification limits compress toward the mean. This Interaction magnifies minor variations—such as spindle warm-up, room temperature changes, and coolant breakdown—into major defects. The system’s Behavior becomes unpredictable, forcing operators to constantly adjust settings, which further destabilizes the process and degrades overall Operational Efficiency.
Process Capability Index (Cpk) Degradation
Cpk = min( [ USL – μ ] / [ 3σ ], [ μ – LSL ] / [ 3σ ] )
As over-specification narrows the distance between USL and LSL, the standard deviation (σ) dominated by machine Anatomy causes Cpk to drop below acceptable limits, driving up defect rates.
The Post-Process Value Sunk and Manufacturing Sunk Cost
The true financial impact of this quality breakdown stems from the position of grinding within the manufacturing sequence. Grinding is almost always the final major operation, performed after raw material sourcing, turning, milling, deep-hole drilling, and heat treatment. Scrap generated at this final gate is highly damaging because it represents a complete loss of all accumulated value. Rejecting a part here destroys the entire investment in labor, machine hours, and prior processing, undermining the Economic Feasibility of the entire production batch.
Table 3.1: Financial Impact of Material Scrap by Production Stage
| Manufacturing Phase | Accumulated Part Value | Scrap Financial Impact | Risk Level for Over-Spec |
|---|---|---|---|
| Raw Material / Blanking | 1.0× (Baseline) | Minimal Loss | Not Applicable |
| Pre-Heat Treat Turning | 2.2× | Moderate Absorption | Low |
| Final Pass Precision Grinding | 8.5× | Severe Capital Drain | Extreme Risk |
Case Study 3: The Gear Shaft Journal Scrap Epidemic
This systemic issue was illustrated during the mass production of an automotive powertrain gear shaft. The design engineer applied a strict surface specification of Ra ≤ 0.10 μm onto the bearing journal diameter, assuming a smoother finish would directly extend bearing lifespan. This decision was made without verifying if standard manufacturing lines could reliably achieve this target.
During production, the machine’s natural structural errors caused surface finishes to fluctuate between Ra 0.11 μm and Ra 0.14 μm—values that are mechanically identical in terms of oil film generation. However, because these fell outside the strict limits of the Blueprint, the quality system automatically flagged them as defects. Since the parts were already fully machined, hobbed, and case-hardened, reworking them was impossible without destroying the case depth. This caused a 14% scrap rate at the final operation gate, throwing away completely finished components. A Deterministic Assessment proved that this over-specification caused a major loss in yield, eroding the project’s Residual Value without providing any boost to the transmission’s field reliability.
4. Designing for Productivity: Functional Tolerance Allocation and Alternative Metrology Metrics
To resolve the systemic losses caused by over-specification, manufacturing enterprises must implement a Deterministic Decision framework directly within the design phase. Moving away from arbitrary tolerance selection requires adopting Design for Manufacturing (DFM) principles tailored specifically for the grinding Mechanism. By shifting from cosmetic perfection to functional necessity, engineering teams can align drawing specifications with the physical realities of machine Anatomy, restoring Operational Efficiency and protecting product margins.
Selective Precision Strategy and Feature Differentiation
The foundational step in reclaiming manufacturing capacity is the application of selective precision. In standard design practices, global block tolerances often apply the same strict requirements to every surface feature on a component. A disciplined DFM Strategy breaks this habit by separating critical mating interfaces from non-functional clearance zones. Relaxing specifications on surfaces that do not support dynamic loads or fluid seals allows the manufacturing line to maximize its Material Removal Rate (MRR), safely bypassing the Hidden Constraints that throttle throughput.
Functional Roughness Parameter Optimization
Ra ≠ f( Performance ) → Define { Rk, Rpk, Rvk }
Where Rk represents core roughness depth, Rpk is reduced peak height, and Rvk is reduced valley depth. Designing around functional parameters allows for larger manufacturing windows while improving lubrication and wear behavior.
Replacing Ra with Functional Topography Metrics
The reliance on the arithmetic average roughness (Ra) remains a major contributor to over-engineering. Ra is a highly limited metric; it cannot distinguish between a surface dominated by sharp peaks and one comprised of smooth plateaus with deep fluid-retaining valleys. By replacing Ra with the linear material ratio curve parameters (the Rk family), designers can target the exact surface Behavior required for load-bearing and lubrication. This metrology shift permits a higher overall roughness value while delivering superior Process Reliability and lowering inspection hurdles.
Table 4.1: Strategic Specification Targets vs. Manufacturing Outcomes
| Surface Classification | Traditional Spec (Over-Spec) | Optimized DFM Spec | Productivity Gains |
|---|---|---|---|
| Dynamic Fluid Seal Radial Shafts | Ra ≤ 0.15 μm (Global) | Rk ≤ 0.30 μm / Rvk ≤ 0.45 μm | Eliminated 3 Grind Passes |
| Static Pilot Locating Diameters | Ra ≤ 0.20 μm | Ra ≤ 0.63 μm (Turned Only) | 100% Process Elimination |
| Structural Web Clearance Regions | Ra ≤ 0.40 μm (Grind) | Ra ≤ 1.60 μm (Milled) | Reduced Setup Time by 75% |
Establishing the Cross-Functional Feedback Loop
True System Integration cannot be achieved through standalone software tools; it requires an active organizational feedback loop between design engineers and production personnel. When manufacturing data—such as machine stiffness, tool wear trends, and real-time Cpk limits—is fed back directly into the initial product design phase, the engineering team can create drawings that are highly compatible with shop floor limits. This collective Interaction prevents unachievable targets from ever reaching a physical machine tool, protecting the Residual Value of investments and establishing a highly efficient production environment.
5. Conclusion: A Value-Centric Paradigm for Surface Engineering and Organizational Alignment
The systemic inefficiencies exposed across precision grinding operations demand more than localized process adjustments; they require a fundamental Cultural Shift in how surface integrity is evaluated. Moving from an outdated model where tighter precision is automatically equated with higher quality to a value-centric approach is no longer optional. To protect corporate margins and maintain Economic Feasibility, the modern manufacturing enterprise must treat the engineering drawing as a dynamic financial blueprint that directly governs shop floor capacity.
The Cultural Shift from Arbitrary Precision to Functional Value
For decades, design departments have operated with a psychological buffer, treating tight tolerances as a risk-mitigation tool. However, as demonstrated by the grinding wheel degradation and post-process value sunk models, this habit introduces massive Hidden Constraints to production lines. True design excellence does not mean specifying the most perfect surface a machine can technically generate; it means identifying the exact threshold where mechanical performance meets Process Reliability, ensuring that no capital is wasted on non-functional features.
The Manufacturing Value Index (MVI)
MVI = [ Functional Lifecycle Gain ] / [ Total Manufacturing Cost × ( 1 / Cpk ) ]
Maximizing the MVI ensures that surface specifications directly support component lifespan while maintaining stable process windows and optimized asset utilization.
Implementing Closed-Loop Data Feedback Networks
To prevent the blueprint fallacy from recurring, organizations must build continuous feedback infrastructure that connects shop floor realities directly to design workstations. When designers can review live machine capability indices, tooling depletion logs, and scrap statistics, they can modify their geometric specifications before production begins. This level of System Integration turns manufacturing limits from an afterthought into a primary design guide, protecting the Residual Value of production equipment and stabilizing yields.
Table 5.1: Strategic Roadmap for Cross-Functional Process Optimization
| Action Item | Organizational Execution | Target Operational Metric |
|---|---|---|
| Specification Auditing | Transition global block Ra limits to local, functional Rk metrics. | Increased Quality Stability |
| Asset Protection | Align production feed rates with natural machine tool stiffness thresholds. | Protected Residual Value |
| Yield Stabilization | Embed pre-process capability validation inside design review gates. | Reduced Total Manufacturing Cost |
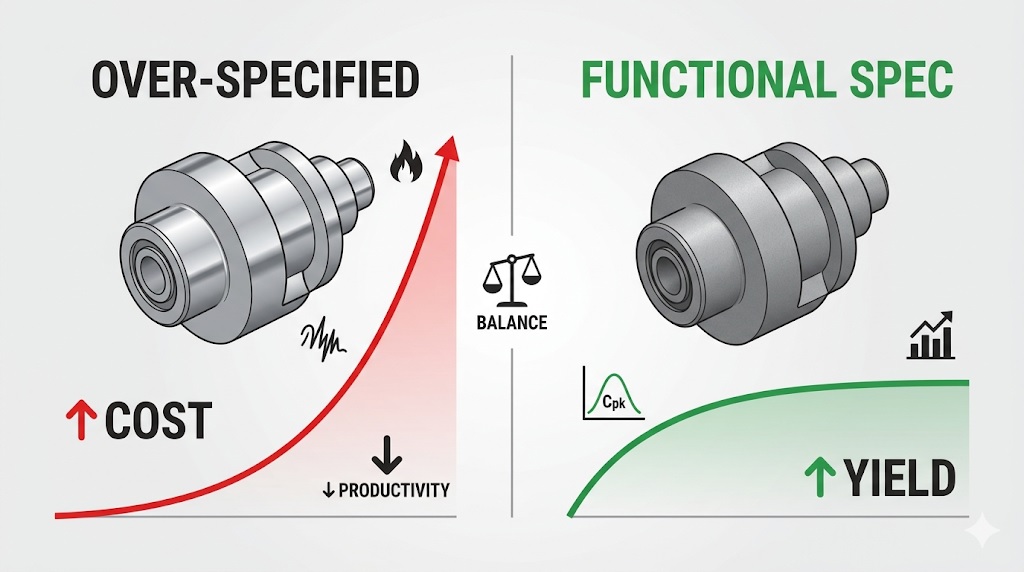
The Ultimate Balance: Unlocking High Yield and Geometric Fidelity
Ultimately, eliminating over-engineering is not about compromising on quality; it is about refining the manufacturing process. When a design focuses purely on functional need, the grinding Mechanism can operate within a healthy, predictable window. This balance eliminates non-productive downtime and prevents late-stage scrap epidemics from hurting margins. By respecting the natural limits of physics and machine Anatomy, manufacturing teams can achieve both high throughput and perfect product performance, securing a highly profitable and sustainable manufacturing operation.
References & Technical Resources
- • Malkin, S., & Guo, C. (2008). Grinding Technology: Theory and Applications of Machining with Abrasives. Industrial Press Inc.
- • Rowe, W. B. (2013). Principles of Modern Grinding Technology. William Andrew Publishing.
- • Tawakoli, T. (1993). High Efficiency Deep Grinding. VDI-Verlag.
- • Marinescu, I. D., et al. (2013). Handbook of Machining with Grinding Wheels. CRC Press.
Related Technical Reading
To deepen your understanding of how design constraints impact both physics and profitability, we recommend the following technical modules: