1. Surface Integrity vs. Functional Requirement: The Economic Directive
In the sophisticated landscape of precision manufacturing, a technical drawing is no longer merely a geometric representation of a part; it is a profound Economic Directive. Specifically, when surface integrity requirements—such as ultra-fine roughness (Ra)—are specified beyond functional necessity, they dictate the entire Mechanism of production. This Deterministic Decision pre-allocates a significant portion of the company’s Residual Value and asset utilization, often without a corresponding increase in actual product performance.
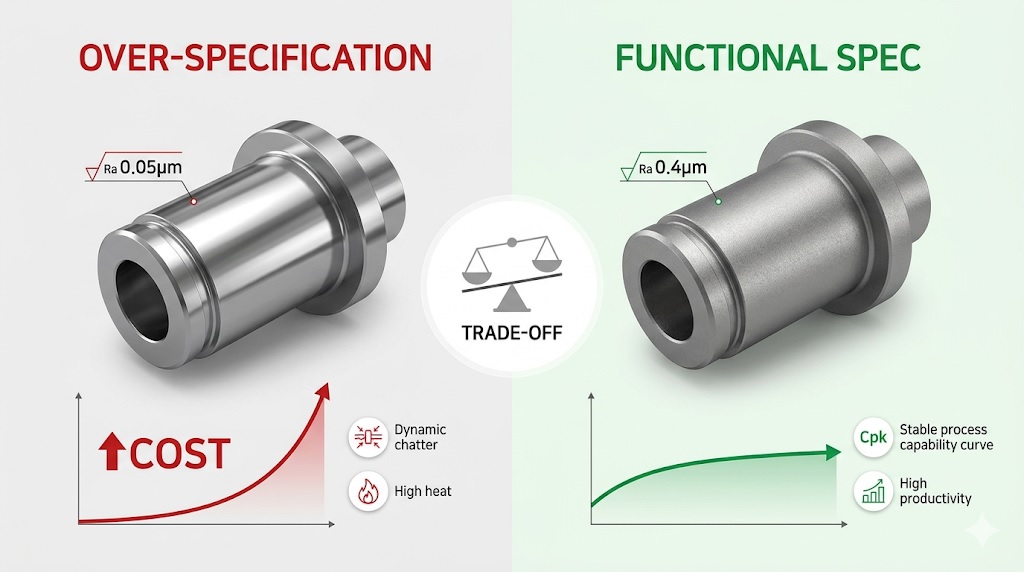
The Over-Specification Crisis and Diminishing Returns
The Interaction between surface finish and manufacturing cost is non-linear and highly sensitive. A “conservative” specification choice, often perceived by designers as a safety buffer for Quality Stability, frequently acts as a Hidden Constraint. Shifting from a functional finish to an arbitrary mirror finish (e.g., Ra < 0.1 μm) can increase costs by 300% while providing zero improvement in fatigue life. This Phenomenon shifts the Economic Feasibility of the product from a high-margin asset to a cost-intensive liability.
Table 1.1: Economic Impact of Surface Specification
| Specification Type | Process Requirement | Financial Consequence |
|---|---|---|
| Functional Requirement | Standard Grinding Parameters | Optimized Operational Efficiency |
| Over-Specification | Low MRR / High Spark-out | Underutilized CAPEX |
Total Cost of Ownership (TCO) Calculation
TCOfinish = Cprocurement + ∑(Coperational × Tcycle_delay) + Cscrap_risk
True Process Reliability is measured by the life-cycle costs dictated by the surface budget. A Deterministic Assessment of TCO reveals that 70% of the manufacturing cost for surface integrity is locked in at the moment the drawing is finalized.
Asset Utilization and Engineering Strategy
Over-specifying surface integrity directly impacts the Operational Efficiency of expensive grinding centers. As finish requirements escalate, the Material Removal Rate (MRR) must be drastically reduced to maintain fidelity, leading to longer cycle times and reduced throughput. This reduction in throughput devalues the Residual Value of the machine tool, as the Anatomy of the system is forced into a state of inefficiency to meet a non-functional standard.
2. Physical Resistance and Thermodynamics: The Sub-surface Reality
Pursuing extreme surface integrity is not merely a geometric challenge; it is a battle against the fundamental laws of thermodynamics. As we strive for a mirror-like finish, the grinding Mechanism enters a regime where the energy required to remove a unit volume of material increases exponentially. This Phenomenon, known as the size effect, shifts the energy balance of the process, potentially compromising the Anatomy of the material’s sub-surface through excessive heat generation.
Energy Displacement and the Grinding Burn Mechanism
In conventional machining, energy is primarily carried away by the chips. However, in fine grinding aimed at high surface integrity, the Interaction between the grit and the workpiece becomes increasingly frictional. When the Material Removal Rate (MRR) is throttled to achieve a low Ra, a greater proportion of the total specific energy is converted into heat that conducts directly into the part. This Hidden Constraint can lead to phase transformations, such as the formation of brittle martensite, which destroys the Quality Stability of the component.
Workpiece Heat Flux Model
qw = Rw × (ec × Qw) / (Ac)
Where Rw is the fraction of heat entering the workpiece, ec is specific energy, and Qw is MRR. As MRR (Qw) drops to meet surface requirements, ec spikes, creating a high-temperature Behavior at the surface.
The Lubrication Paradox: Topography vs. Performance
There is a technical misconception that a lower Ra always equates to better lubrication. In reality, a surface that is “too perfect” may lack the micro-voids necessary for oil retention. This lack of Geometric Fidelity to functional lubrication needs can lead to immediate seizing in boundary lubrication conditions. A Deterministic Assessment of the surface topography often shows that a controlled, plateau-honed finish provides superior Process Reliability compared to a pure mirror finish.
Residual Stress and Structural Integrity
The pursuit of aesthetics often masks the Phenomenon of tensile residual stress. While the surface appears flawless, the underlying Anatomy may be under high tension due to thermal gradients. This tension acts as a catalyst for fatigue crack initiation, effectively reducing the Residual Value of the part’s service life. True Economic Feasibility must prioritize the compressive stress state over visual luster.
3. Parameter Volatility: The Economic Trade-off of MRR and Surface Integrity
To maintain the strict Geometric Fidelity dictated by over-specified surface requirements, the grinding Mechanism must undergo a radical shift in operational parameters. The most immediate casualty of ultra-fine surface specifications is the Material Removal Rate (MRR). A Deterministic Assessment reveals that as the required Ra value decreases, the process must transition from productive shearing to a low-energy state, effectively sacrificing Operational Efficiency to stay within the narrow specification window.
The Velocity Penalty and Cycle Time Escalation
The pursuit of sub-micron surface finishes forces a Strategy of “light and slow” machining. To minimize the thermal surges and elastic deflections discussed in Chapter 2, depth of cut and feed speeds are often reduced to 20% or less of the machine’s Anatomy capability. This Phenomenon creates a production bottleneck where high-performance capital equipment is restricted to a crawl, significantly inflating the Total Manufacturing Cost per unit.
Total Cycle Time Modeling
Tcycle = (Vrem / MRR) + Tdress + Tgauge + Tspark-out
Equation 3.1: As MRR decreases and spark-out time increases to meet surface demands, Tcycle expands non-linearly.
Dressing Strategy Overload and Consumable Depletion
Maintaining Quality Stability under tight surface requirements necessitates that the grinding wheel remains in a state of maximum sharpness. This leads to an aggressive Dressing Strategy, where the wheel is dressed more frequently to prevent grain dulling. The Interaction between frequent dressing and fine tolerance creates a double-edged economic loss: the rapid depletion of the wheel’s Residual Value and the accelerated wear of expensive diamond dressers, both eroding the Economic Feasibility of the operation.
Table 3.1: Parameter Volatility vs. Manufacturing Cost
| Parameter | Action for Fine Finish | Economic Impact |
|---|---|---|
| Infeed Speed | Drastic Reduction | Increased Labor & Machine Hours |
| Dressing Frequency | 3× to 5× Increase | High Consumable OPEX |
| Spark-out Passes | Extensive Cycles | Zero-MRR Time Waste |
The Dominance of Non-Productive Time
In ultra-precision grinding, actual metal removal often becomes secondary to non-productive activities. Extensive periods where the wheel traverses without cutting depth are mandatory to allow for System Integration elastic recovery and thermal stabilization. This Hidden Constraint means that for critical surface features, up to 70% of machine time is non-productive, creating a massive gap between the machine’s Theoretical Capacity and its actual Operational Efficiency.
4. Statistical Collapse: Cpk Erosion and the Hidden Scrap Cost
As surface integrity requirements approach the microscopic limits of the machine’s Anatomy, we witness the Phenomenon of process capability (Cpk) erosion. In a standard manufacturing environment, a Cpk of 1.33 is often the benchmark for Quality Stability. However, when surface specs are tightened without a corresponding upgrade in System Integration, the “Process Window” narrows to a point where even minor stochastic variations lead to non-conformance and a collapse of Economic Feasibility.
The Mechanism of Stochastic Defect Generation
When the Interaction between inevitable grinding wheel wear and microscopic thermal drift exceeds the allowable specification, the probability density function of the process shifts toward the limits. This Mechanism forces the operator into a reactive compensation loop, where constant adjustments are required to maintain Geometric Fidelity. Such instability destroys Operational Efficiency and shifts the Total Manufacturing Cost from productive labor to expensive, manual over-processing.
Modeling Hidden Scrap Cost
Costfailure = ∫LSLUSL P(x) ⋅ (Vadded + Cdisposal) dx
Equation 4.1: The financial impact of out-of-tolerance probability relative to the accumulated value (Vadded) of the part.
The Sunk Cost of Final Stage Grinding
Grinding is typically the final operation in a part’s Anatomy. Therefore, a scrap part at this stage represents the loss of all cumulative value—raw material, turning, heat treatment, and prior machining. This Hidden Constraint means that a 1% scrap rate in fine grinding is far more damaging to Economic Feasibility than failures in initial roughing stages. The Quality Cost (COQ) model must account for this disproportionate impact on Residual Value.
Table 4.1: Cpk Levels vs. Quality Cost Risk
| Process State | Cpk Level | Risk Strategy |
|---|---|---|
| Robust | > 1.67 | High Operational Efficiency; Sampling Only |
| Marginal | 1.0 – 1.33 | Frequent Inspection; Reduced Throughput |
| Critical | < 0.67 | 100% Inspection; Massive Scrap Risk |
Metrology Challenges and Measurement Uncertainty
As surface integrity requirements shrink, the Behavior of the measurement environment becomes a primary bottleneck. When the required Ra is in the same magnitude as the measurement system’s uncertainty, the Deterministic Assessment of “good” vs. “bad” parts becomes impossible. This ambiguity forces a defensive Strategy where parts are rejected simply because their Geometric Fidelity cannot be verified, further eroding the Residual Value of the production batch.
5. Strategic Alternatives: Design for Manufacturing (DFM) and Functional Allocation
To escape the “Precision Trap” where costs escalate without proportional functional gain, a Deterministic Decision must be made to integrate manufacturing constraints back into the design phase. Design for Manufacturing (DFM) in the context of surface integrity involves the strategic allocation of specifications based on functional necessity. This Strategy ensures that Geometric Fidelity is prioritized only where it adds real-world performance value, preserving the Economic Feasibility of the product.
Functional Allocation and Selective Precision
The most effective Approach to reducing Total Manufacturing Cost is the separation of critical and non-critical surface zones. By allowing for generous specifications on non-functional surfaces, the Mechanism of material removal can remain aggressive, preserving Operational Efficiency for the areas that truly matter. This System Integration between design and production allows for a more balanced Blueprint that respects the machine’s physical Anatomy.
Table 5.1: Functional vs. Arbitrary Specification Strategy
| Feature Category | Surface Strategy | Cost Benefit |
|---|---|---|
| Mating Interfaces | High Precision (Functional) | Performance Assurance |
| Clearance Zones | Relaxed (High MRR) | Cycle Time Reduction |
| Aesthetic Surfaces | Moderate (Standard) | Reduced Tool Wear |
Beyond Ra: Utilizing Functional Topography Metrics
Modern engineering Behavior should shift from simple Ra values to functional parameters like Rk (core roughness) or Rvk (reduced valley depth). These metrics provide a more Deterministic Assessment of how a surface will actually perform in terms of oil retention and wear resistance. By specifying the right topography rather than the lowest roughness, designers can achieve superior Process Reliability while significantly lowering the Quality Stability burden on the shop floor.
Digital Twin and Process Simulation
Utilizing Digital Twin technology allows for the simulation of the grinding Mechanism before physical production begins. This System Integration identifies potential thermal damage or Cpk failure zones in the virtual environment. By adjusting the Blueprint based on these simulations, companies can protect the Residual Value of their raw materials and capital assets, ensuring that the final physical execution is both optimized and deterministic.
6. Conclusion: A Value-Centric Paradigm for Surface Integrity
The journey from a static Blueprint to a high-performance component concludes with a fundamental Cultural Shift in engineering philosophy. As established throughout this synthesis, the pursuit of extreme surface integrity is not an isolated quality goal but a complex Interaction of thermodynamics, mechanics, and economics. To maximize Economic Feasibility, the modern enterprise must transition from a “more is better” precision model to a value-centric approach where every micron is functionally justified.
Collaborative Engineering and Data-Driven Feedback
The key to sustaining Process Reliability lies in the feedback loop between the shop floor and the design office. When designers understand the physical Anatomy of grinding burnout and elastic deflection, they can make Deterministic Decisions that optimize both performance and cost. This System Integration ensures that the Mechanism of production is leveraged at its peak Operational Efficiency, preventing the waste of capital resources on non-functional perfection.
Table 6.1: Engineering Recommendations for Future Excellence
| Strategic Focus | Actionable Recommendation | Expected Outcome |
|---|---|---|
| Specification Strategy | Replace arbitrary Ra with functional Rk metrics. | Optimized Quality Stability |
| Asset Management | Prioritize real-time thermal compensation systems. | Protected Residual Value |
| Cost Analysis | Incorporate final-stage scrap risks into TCO models. | Reduced Total Manufacturing Cost |
Adaptive Control and the Limits of Physics
Looking forward, the next frontier in Process Reliability is the adoption of adaptive control systems that use neural networks to predict and counteract the Phenomenon of wheel wear and thermal drift in real-time. However, even the most advanced AI cannot overcome a fundamentally flawed Blueprint. The ultimate Strategy remains a deterministic design that respects the physical limits of the material and the economic realities of the marketplace.
Final Summary
In conclusion, surface integrity must be managed as a strategic asset. By moving away from the Hidden Constraints of over-specification and embracing a Deterministic Assessment of functional needs, manufacturers can achieve superior product quality while drastically improving their Economic Feasibility. The blueprint is not just a drawing; it is the ultimate lever for financial and technical success in the era of precision manufacturing.
References & Technical Resources
- • Malkin, S., & Guo, C. (2008). Grinding Technology: Theory and Applications of Machining with Abrasives. Industrial Press Inc. (Theoretical basis for energy partitioning and surface integrity)
- • Rowe, W. B. (2013). Principles of Modern Grinding Technology. William Andrew Publishing. (Key reference for surface topography metrics and process stability)
- • Tawakoli, T. (1993). High Efficiency Deep Grinding. VDI-Verlag. (Analysis of MRR vs. surface integrity trade-offs)
- • Marinescu, I. D., et al. (2013). Handbook of Machining with Grinding Wheels. CRC Press. (Technical data for dressing strategy and asset management)
Related Technical Reading
To deepen your understanding of how design constraints impact both physics and profitability, we recommend the following technical modules: