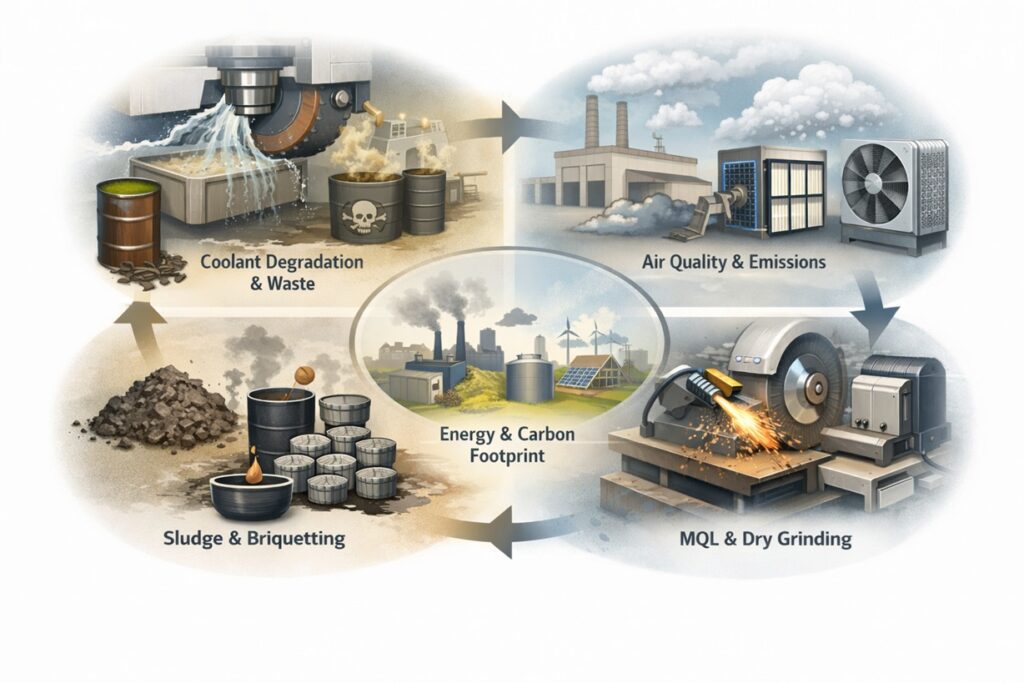
1. Introduction: The Hidden Price of Precision and the Regulatory Shift
In the pursuit of sub-micron surface integrity, the grinding process has traditionally relied on a high-volume throughput of synthetic oils and chemical lubricants. While these fluids are essential for managing the Thermal Flux at the contact zone, they have introduced a significant Environmental Compliance Cost that is no longer ignorable. Modern manufacturing is currently caught in a pincer movement between tightening global regulations—such as EU REACH and EPA effluent guidelines—and the rising operational expense of waste management.
The Conflict Between Tribology and Ecology
The fundamental Mechanism of grinding requires a high Specific Grinding Energy (us), a large portion of which is converted into heat. To prevent metallurgical burn, coolant flow rates often exceed several hundred liters per minute. However, this fluid is not a static asset; it is a chemically active agent that degrades over time, capturing fine metallic swarf and abrasive grit to form a hazardous sludge.
This degradation creates a Regulatory Burden. As the concentration of dissolved heavy metals (e.g., Chromium, Nickel) increases within the coolant cycle, the fluid transitions from an operational necessity to a regulated waste product. Manufacturers are now forced to account for the Total Cost of Ownership (TCO) of their fluids, which includes not only the initial purchase price but also the exponential costs of filtration, antimicrobial stabilization, and certified disposal.
Quantifying the Compliance Deficit
The financial impact of environmental compliance is often buried in general overhead, masking the true cost per part. To restore economic transparency, we must analyze the Energy-Waste Mechanism. The relationship between material removal and carbon footprint is governed by the efficiency of the machine’s auxiliary systems—pumps, chillers, and mist collectors—which often consume more energy than the grinding spindle itself.
Cenv = Cproc + Cdisp + Creg
Equation 1.1: Total Environmental Compliance Cost Mechanism
Where Cproc represents the cost of fluid maintenance, Cdisp is the disposal fee for contaminated sludge, and Creg accounts for the administrative and insurance costs associated with regulatory adherence. As Creg continues to climb due to carbon taxes and stricter landfill bans, the traditional “wet grinding” model is facing a sustainability crisis. This article will dissect these cost drivers and explore how Deterministic Process Control can mitigate environmental liabilities without sacrificing precision.
The Compliance Axiom: “Environmental integrity in grinding is no longer an ethical choice; it is a financial imperative. The Mechanism of the process must evolve from ‘flush-and-forget’ to a circular economy where waste is treated as a lost profit variable.”
2. The Fluid Lifecycle: Coolant Management and Disposal Costs
In high-volume grinding, the metalworking fluid (MWF) is the lifeblood of the operation. However, unlike the solid components of a machine tool, the coolant is a Dynamic Chemical System that begins to degrade the moment it is charged into the reservoir. This degradation is not merely a technical nuisance; it is a primary driver of Environmental Compliance Cost. To maintain data reliability in cost modeling, manufacturers must shift from viewing coolant as a “consumable” to managing it as a High-Maintenance Asset with a finite, regulated lifecycle.
The Mechanism of Bio-Chemical Degradation
The “Fluid Lifecycle” is governed by the Mechanism of Microbiological Proliferation. Water-based emulsions provide an ideal breeding ground for anaerobic bacteria and fungi. As these microorganisms consume the emulsifiers and corrosion inhibitors, the fluid’s pH level drops, leading to the “souring” of the coolant. This chemical shift triggers two immediate financial liabilities:
- Structural Instability: The emulsion breaks down, reducing the lubricity required to minimize the Specific Grinding Energy (us).
- Toxic Byproducts: The release of hydrogen sulfide (H2S) and other volatile compounds increases the burden on Mist Collection Systems and triggers stricter OSHA/HSE workplace air quality compliance audits.
Tramp Oil and the Filtration Deficit
A secondary Mechanism that accelerates disposal costs is the infiltration of Tramp Oil (way lube and hydraulic fluids). When tramp oil emulsifies into the grinding fluid, it acts as a nutrient for bacteria and physically coats the abrasive grains, leading to “loading” of the wheel. This forces the operator to increase the Dressing Frequency, which in turn increases the volume of Grinding Sludge—a regulated waste product that is significantly more expensive to dispose of than clean metallic swarf.
Lf = (Vt · ηm) / (Rbio + Rcont)
Equation 2.1: Fluid Longevity (Lf) Decay Mechanism
Equation 2.1 illustrates that the fluid’s functional life (Lf) is a product of total volume (Vt) and maintenance efficiency (ηm), inversely proportional to the rates of biological decay (Rbio) and external contamination (Rcont). When Lf reaches its regulatory limit, the cost of disposal is no longer a simple tipping fee; it involves Chain-of-Custody documentation and high-temperature incineration or chemical treatment, often costing 3 to 5 times the initial purchase price of the concentrate.
The Lifecycle Axiom: “The cheapest coolant is the one that stays in the machine the longest. Every liter sent for disposal represents a failure of the maintenance Mechanism and a direct hit to the ROI of the grinding cell.”
3. Sludge and Swarf: The Regulatory Burden of Waste Handling
In the hierarchy of manufacturing waste, grinding residue occupies a uniquely problematic position. Unlike the dry, segregated chips produced in milling or turning, Grinding Sludge is a complex, saturated mixture of metallic swarf, spent abrasive grains, and residual coolant. This multi-phase composition triggers a specific Regulatory Mechanism that shifts the waste from “recyclable metal” to “hazardous chemical waste,” drastically altering the Compliance Cost structure of the facility.
The Hazardous Waste Classification Mechanism
The primary driver of waste handling costs is the Toxicity Characteristic Leaching Procedure (TCLP) and similar international standards (e.g., EU Waste Framework Directive). When grinding high-alloy steels, the resulting sludge contains concentrated levels of Chromium, Nickel, and Cobalt. The Mechanism of Bio-accumulation of these heavy metals means that if the sludge contains more than a specific percentage of coolant (typically >20% moisture content), it cannot be sent to standard metal recyclers.
Instead, it must be treated as “Hazardous Waste,” requiring specialized transport manifests, environmental insurance, and high-temperature stabilization or specialized landfill disposal. This reclassification represents a Step-Change in Cost, often increasing the disposal expense by 400% to 600% compared to dry scrap.
Dewatering and Briquetting: The ROI of Volume Reduction
To mitigate these costs, the Mechanism of Mechanical Dewatering is employed. By using centrifuges or briquetting presses, the coolant can be reclaimed and the sludge volume reduced by up to 80%. This directly impacts the Environmental Compliance Cost by reducing the “Waste Mass Variable” in the financial model.
Cwaste = Mtotal · [ (Rf · Chaz) + (1 – Rf) · Cstd ]
Equation 3.1: Weighted Waste Disposal Cost Mechanism
In Equation 3.1, Cwaste is the total disposal cost, where Rf is the fraction of waste classified as hazardous due to moisture or heavy metal content. Chaz and Cstd represent the respective unit costs for hazardous and standard disposal. Reducing Rf through effective Briquette Compression not only saves direct disposal fees but also allows for the recovery of expensive grinding oils, creating a circular Mechanism of Profit Recovery.
The Waste Axiom: “In the eyes of the regulator, grinding sludge is not metal; it is a chemical liability. Every kilogram of coolant left in the sludge is a double-tax: once as a lost raw material, and once as a hazardous waste surchage.”
4. Mist and Emissions: Compliance with Air Quality Standards
High-velocity grinding operations transform liquid coolant into a volatile suspension of microscopic droplets known as Oil Mist. This physical transformation is not merely an indoor air quality issue; it is a critical Regulatory Compliance Interface. As global standards for Permissible Exposure Limits (PEL) tighten—driven by organizations like NIOSH and OSHA—the Mechanism for capturing these emissions has evolved from simple ventilation to high-energy multistage filtration, introducing significant auxiliary costs.
The Atomization Mechanism in High-Speed Grinding
The generation of mist is governed by the Mechanism of High-Shear Atomization. When coolant is injected into the contact zone at peripheral wheel speeds (vs) exceeding 60–120 m/s, the kinetic energy shatters the fluid into sub-micron particles (0.5 to 10 μm). These particles are small enough to remain buoyant in the factory atmosphere and, more critically, are deep-lung respirable, triggering Environmental Health and Safety (EHS) liabilities.
Pressure Drop and the Energy-Cost Correlation
Compliance with zero-emission standards requires the use of HEPA (High-Efficiency Particulate Air) filters. However, as the filter media captures fine grinding dust and oil, it develops a Pressure Drop (ΔP). To maintain the required Capture Velocity at the machine enclosure, the extraction fan must increase its RPM, leading to a non-linear increase in energy consumption.
Pfan ∝ Q · ΔP / ηtotal
Equation 4.1: Mist Extraction Energy-Cost Mechanism
Equation 4.1 demonstrates that fan power (Pfan) is directly proportional to the volumetric flow (Q) and the pressure drop (ΔP). In a facility with 50 grinding cells, the Environmental Compliance Cost of maintaining 0.5 mg/m³ of oil mist concentration can account for up to 15% of the total factory electricity bill. This “Hidden Energy Tax” is the direct result of striving for regulatory perfection in a high-emission Abrasive Mechanism.
The Emission Axiom: “If you can smell the coolant, you are inhaling a liability. Air quality compliance is a battle against the Mechanism of Atomization, where the cost of filtration is the price of protecting your most valuable asset: the workforce.”
5. Transitioning to MQL and Dry Grinding: A Cost-Benefit Analysis
As the Environmental Compliance Cost of flood cooling continues to escalate, many high-precision manufacturers are evaluating Minimum Quantity Lubrication (MQL) and Dry Grinding as strategic alternatives. This transition is not a simple hardware swap; it represents a fundamental shift in the Tribological Mechanism of the contact zone. While removing liquid coolant eliminates the liability of fluid disposal, it introduces a severe Thermal Challenge that must be managed through deterministic process design to maintain surface integrity.
The Lubrication vs. Cooling Mechanism
In flood grinding, the fluid serves two roles: lubrication (reducing friction) and cooling (removing heat). MQL functions by a different Mechanism—delivering a fine aerosol of biodegradable vegetable oil directly into the grain-workpiece interface. By optimizing the Aerosol Particle Size, MQL reduces the Specific Grinding Energy (us) through superior lubrication, thereby generating less heat at the source.
However, the Heat Sink Mechanism of MQL is nearly zero compared to flood cooling. Without the massive convective heat transfer of water-based fluids, the Energy Partition (Rw)—the percentage of total energy entering the workpiece—becomes the critical variable. To prevent thermal damage, MQL must be paired with highly porous, vitreous-bonded wheels or CBN abrasives that facilitate mechanical “self-cooling” through chip evacuation.
The ROI of “Green” Grinding
The economic justification for MQL lies in the Displacement of Hidden Costs. By eliminating the coolant reservoir, pumps, and hazardous sludge handling, the manufacturer effectively zeros out Cproc and Cdisp from the environmental cost equation.
ROImql = (ΣCflood_ops – ΣCmql_ops) / CAPEXmql
Equation 5.1: MQL Transition Return on Investment Model
Equation 5.1 compares the total operating costs of flood cooling (maintenance, energy, disposal) against the minimal lubricant consumption of MQL. In many cases, the reduction in Regulatory Compliance Labor and Energy Consumption allows for a CAPEX payback period of less than 18 months. Furthermore, MQL produces dry metallic chips, which possess a higher scrap value compared to saturated sludge, turning a waste liability into a secondary Revenue Mechanism.
The Green Axiom: “MQL is not about removing fluid; it is about replacing a cooling Mechanism with a lubrication Mechanism. The environmental ROI is only realized when the process is re-engineered to prevent the heat that the fluid used to hide.”
6. Energy Intensity: Carbon Footprint and Electricity Regulation
In the era of Decarbonization, the energy consumed by a grinding machine is no longer just a utility bill; it is a tracked emission variable. With the implementation of frameworks like the Carbon Border Adjustment Mechanism (CBAM) and ISO 50001, the Energy Intensity of a process has become a direct component of the Environmental Compliance Cost. Because grinding is inherently an energy-dense Mechanism, the “Carbon Tax” per part can significantly erode the profit margins of high-precision components.
The Mechanism of Energy Partition and Waste
Abrasive processes are notorious for their low energy efficiency. The Mechanism of Chip Formation in grinding consumes orders of magnitude more Specific Grinding Energy (us) than milling, as a vast majority of the energy is wasted in Plowing and Rubbing. This wasted energy translates directly into a higher carbon footprint.
Furthermore, the “Non-Cutting Energy”—the electricity required to run high-pressure coolant pumps, mist extractors, and thermal chillers—often exceeds the energy used for actual material removal. For a standard 20kW spindle, the auxiliary systems may consume an additional 30-40kW. Under Electricity Regulation and peak-load pricing, this ancillary Energy Drain Mechanism becomes a primary target for cost reduction.
Quantifying the Carbon Liability
To align with corporate ESG (Environmental, Social, and Governance) goals, engineers must calculate the CO2 Equivalent for every batch. This calculation bridges the gap between mechanical work and regulatory compliance.
CO2,part = (Espindle + Eaux) · EFgrid / Ynet
Equation 6.1: Carbon Footprint per Net Salable Yield
Equation 6.1 highlights a critical truth: the carbon footprint per part is inversely proportional to the Net Salable Yield (Ynet). A process that produces scrap due to poor thermal control effectively doubles its energy intensity, as the energy spent on the scrapped part is wasted. Thus, Process Stability is the most effective Mechanism for carbon reduction. By reducing the energy wasted in plowing and minimizing the “Auxiliary Overhead,” manufacturers can meet strict Tier-1 Automotive and Aerospace carbon-neutral mandates.
The Energy Axiom: “In a carbon-regulated economy, wasted energy is a double loss. To reduce the carbon footprint of grinding, you must first optimize the Mechanism of the cut—efficiency in the contact zone is the purest form of sustainability.”
7. Strategic ROI: Investing in Green Abrasive Technology
The final hurdle in mastering the Environmental Compliance Cost is the shift from a reactive mindset to a strategic investment model. Historically, green technologies—such as advanced filtration, recycling systems, and low-impact abrasives—were viewed as CAPEX burdens. However, the modern Financial Mechanism of manufacturing proves that the “Cost of Inaction” (penalties, rising disposal fees, and energy taxes) far exceeds the cost of upgrading to sustainable technology.
The Mechanism of Life-Cycle Cost Mitigation
Strategic ROI is realized through the Synergy Mechanism of improved process stability and waste reduction. For instance, investing in Vitrified CBN (Cubic Boron Nitride) wheels allows for significantly longer dressing intervals compared to conventional Alumina wheels. This does not just reduce tooling costs; it fundamentally alters the environmental footprint by:
- Reducing Sludge Volume: Less frequent dressing means fewer abrasive particles are shed into the coolant, maintaining fluid purity longer.
- Energy Optimization: CBN’s superior thermal conductivity reduces the Specific Grinding Energy (us), lowering the carbon tax per part.
Advanced Filtration: Turning Liability into Asset
Implementing Closed-Loop Filtration Systems represents a high-impact ROI Mechanism. By integrating 1-micron filtration with magnetic separators, the fluid can be kept in a “perpetual state,” eliminating the Cdisp (Disposal Cost) almost entirely. In a 24/7 production environment, the savings from reclaimed oil and avoided hazardous waste surcharges can result in a Net Present Value (NPV) that justifies the equipment in under 24 months.
ROIenv = (ΔOPEXyr + ΔFineavoided) / I0
Equation 7.1: Strategic Environmental ROI Mechanism
Equation 7.1 defines the ROI as the sum of annual operational savings (ΔOPEX) and the avoidance of regulatory fines (ΔFine), divided by the initial investment (I0). In jurisdictions with aggressive carbon and waste enforcement, the ΔFineavoided variable becomes a massive driver of the Economic Mechanism, protecting the firm against unpredictable regulatory shifts.
The Investment Axiom: “Green technology is not an expense; it is a Hedge Mechanism against the rising cost of environmental non-compliance. The highest ROI is found at the intersection of process stability and regulatory resilience.”
8. Conclusion: Environmental Integrity as a Competitive Advantage
The analysis of Environmental Compliance Cost in grinding reveals a fundamental truth: the era of treating waste and energy as “fixed overhead” is over. As global regulations evolve from local workplace safety standards to integrated carbon and chemical frameworks like CBAM and REACH, the ability to minimize environmental impact has become a core Mechanism of operational survival.
The Convergence of Physics and Policy
As we have explored, every kilogram of hazardous sludge and every kilowatt-hour of wasted plowing energy is a direct indicator of process inefficiency. By mastering the Abrasive Mechanism—from deterministic dressing to MQL transition—manufacturers do more than just avoid fines. They stabilize the contact zone, extend tool life, and ensure the Data Reliability required to compete in high-value sectors such as aerospace and electric vehicle (EV) component manufacturing.
A Strategic Roadmap for the Future
To maintain a competitive edge, organizations must adopt a three-pillar Strategic Mechanism:
- Transparency: Moving environmental costs from general overhead to the “Cost Per Part” model using Life-Cycle Assessment (LCA) data.
- Innovation: Investing in superabrasives and closed-loop filtration to decouple production volume from waste generation.
- Compliance: Treating regulatory adherence not as a hurdle, but as a Validation Mechanism for process excellence.
In conclusion, environmental integrity is not a constraint on precision; it is its ultimate metric. The manufacturers who thrive in the coming decade will be those who view their coolant, energy, and waste through the lens of Profit Optimization. When the Mechanism is clean, the process is lean, and the yield is certain.
The Ultimate Compliance Mantra
“Waste is the physical manifestation of an unoptimized Mechanism. To master your costs, you must master your impact. Environmental leadership is the new standard of precision.”
References & Technical Resources
Primary Engineering References
- • Malkin, S., & Guo, C. (2008). Grinding Technology: Theory and Applications of Machining with Abrasives. Industrial Press. (Fundamental energy partition and us modeling).
- • Rowe, W. B. (2014). Principles of Modern Grinding Technology. William Andrew. (Comprehensive analysis of fluid management and thermal stability).
- • Marinescu, I. D., et al. (2006). Handbook of Machining with Grinding Wheels. CRC Press. (Economic modeling of consumables and waste handling).
- • Brinksmeier, E., et al. (1999). Environmental Aspects of Grinding. CIRP Annals. (The foundational Mechanism of coolant degradation and disposal impact).
Internal Technical Deep-Dive
For further exploration of the environmental and economic principles discussed in this report, please refer to the following internal technical modules:
COST ARCHITECTURE:
Why Grinding Costs Vary So Widely: Hidden Factors Beyond Wheel Price
PROCESS STABILITY:
Grinding Process Stability: Why Stable Processes Reduce Total Manufacturing Cost
STRATEGIC ROI:
Grinding Automation ROI: When Does Automation Actually Pay Off?
QUALITY & YIELD:
Process Capability (Cp, Cpk) in Grinding: Why Surface Integrity Matters for Yield