1. Introduction: The “Iceberg” of Grinding Economics
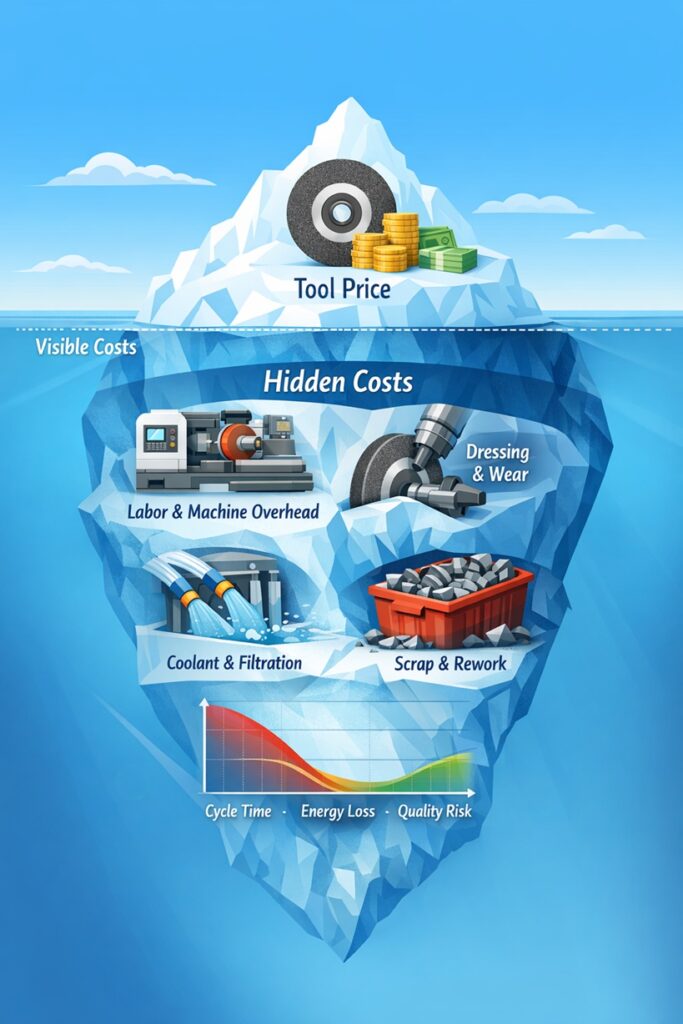
In the ultra-precision manufacturing sector—specifically within the Tier-1 automotive and aerospace supply chains—cost optimization is often reduced to a simple negotiation over the unit price of consumables. However, in the complex domain of abrasive machining, this narrow focus on “invoice price” is not only misleading but economically dangerous. The purchase price of a grinding wheel is merely the visible 10% tip of a massive economic iceberg. Beneath the surface lies a complex web of indirect costs and hidden inefficiencies that dictate over 80% of the total cost-per-part.
To understand why grinding costs vary so widely between two identical production lines, we must analyze the process through the lens of Total Cost of Ownership (TCO). Grinding is fundamentally a high-energy thermo-mechanical interaction. Unlike turning or milling, where the cutting edge is defined and static, a grinding wheel’s topography is stochastic and dynamic. This means that a “cheap” wheel that necessitates conservative Specific Material Removal Rates (Q’w) to avoid thermal damage (Grinding Burn) effectively inflates the most expensive variables in the factory: machine overhead and non-productive time.
The Dichotomy of Direct vs. Latent Costs
Why does one facility produce a precision-ground shaft for $3.50 while another spends $6.20 for the exact same specification? The answer rarely resides in the price difference between their abrasives. Instead, it is found in the Energy Partition (Rw)—the percentage of total grinding heat that enters the workpiece versus the chips and the fluid. A poorly specified, low-cost wheel often suffers from rapid Attritious Wear, where the grains dull and rub the metal instead of shearing it. This “rubbing” increases the Specific Grinding Energy (u), requiring more spindle power and causing thermal expansion that leads to dimensional scrap.
The High Price of “Zero-Defect” Compliance
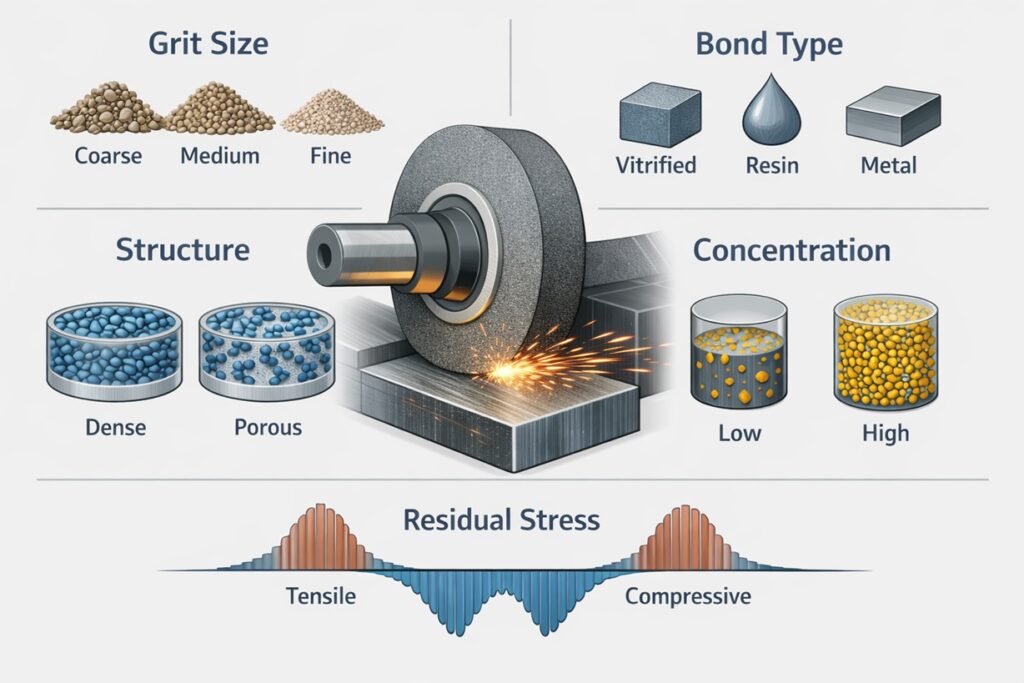
In the era of Electric Vehicles (EVs), the cost of quality has surpassed all other variables. With the elimination of internal combustion engine noise, the “whine” of a reduction gear set becomes a primary failure mode. Achieving the necessary micro-geometry while maintaining compressive residual stress requires a grinding process that is thermally stable and vibration-damped.
A single field failure due to “Invisible Damage”—thermal re-tempering that passes visual inspection but fails in operational stress—can lead to a global recall costing tens of millions of dollars. When viewed through this lens, the ROI (Return on Investment) of a high-performance Vitrified CBN wheel or a specialized dressing strategy is not calculated in cents per part, but in the avoidance of catastrophic liability and the maximization of Mechanical Permanence.
Hard Reality from the Shop Floor: “Procurement loves to boast about a $50 saving on a wheel. But as an engineer, I see the $200 per hour machine overhead wasted because that wheel requires dressing every 10 parts. In precision grinding, the only way to truly cut costs is to stop buying ‘abrasives’ and start buying ‘available machine time’ and ‘metallurgical safety’.”
Thesis of this Technical Analysis
This report will systematically dismantle the traditional view of grinding economics. We will explore how Specific Grinding Energy (us), Dressing Dynamics, and Filtration Accuracy interact to determine the final balance sheet. By the end of this analysis, we will demonstrate that “cheaper” is often the most expensive word in the grinding department, and that true cost leadership is only achieved by mastering the thermo-mechanical variables that govern the abrasive-workpiece interface.
2. Labor and Machine Overhead: The Invisible Giant in the Cost Structure
In many Tier-1 automotive grinding cells, the “Abrasive Cost per Part” is tracked with religious fervor, often down to the fourth decimal place. However, this granular focus is fundamentally misplaced and economically dangerous. The true titan of the grinding cost structure is not the abrasive grain, but the Time-Dependent Costs: Labor and Machine Overhead. In a high-precision production environment, the Machine Overhead Rate (Cm)—which incorporates the amortization of multi-million dollar CNC systems, floor space value, energy consumption, and preventative maintenance—can range from $120 to over $350 per hour. When you integrate the cost of skilled labor (Cl), the “burn rate” of a single grinding station becomes the primary driver of the entire production economy.
The Mathematics of Cycle Time (tc) vs. Net Profitability
The fundamental economic equation of grinding is centered on the Cycle Time per Piece (tc), not the volume of abrasive consumed. To understand the scale of this impact, let us analyze a typical production scenario involving EV reduction gears. A conventional Al2O3 wheel might cost $500 and allow for a specific material removal rate (Q’w) that results in a 60-second cycle time. In contrast, a high-performance Vitrified CBN wheel costing $3,000 may seem exorbitant. However, due to its extreme thermal conductivity and hardness, it can support an increased feed rate (vf) that slashes the cycle time to 40 seconds.
This 33% reduction in time does more than just save 20 seconds; it redistributes the fixed costs of the factory. If the machine overhead is $180/hour ($0.05/second), the 20-second saving translates to a direct reduction of $1.00 in overhead cost per part. Over a production run of 100,000 units, the “expensive” wheel generates $100,000 in overhead savings, making its $2,500 price premium entirely irrelevant. This is the Efficiency Paradox that procurement teams often fail to grasp when looking at a line-item budget.
Deciphering Non-Productive Time (tnp): The Silent Profit Killer
Beyond the actual time the wheel is in contact with the metal, the most significant hidden cost resides in Non-Productive Time (tnp). This encompasses wheel changeovers, truing and dressing sequences, and the subsequent “first-part” inspection cycles. A low-cost wheel often suffers from a poor G-ratio (volume of metal removed vs. volume of wheel wear), necessitating frequent dressing cycles (fd) to restore its abrasive topography.
Every time the spindle stops for dressing, the machine is not generating value; it is consuming overhead. In a high-volume line, a wheel that remains stable for 10,000 parts versus one that requires a dressing intervention every 50 parts provides a massive boost in Overall Equipment Effectiveness (OEE). For a facility operating at 85% capacity, a wheel that reduces downtime effectively acts as a “virtual machine,” expanding capacity without the multi-million dollar CAPEX required to buy an additional grinding center.
The Production Reality: “When the machine isn’t making sparks, it’s making debt. A wheel that lasts an entire week on the spindle without a changeover is worth its weight in gold, not because of the abrasive it saves, but because of the Labor Utilization and Machine Uptime it guarantees.”
Therefore, to achieve a competitive cost-per-part, engineers must look at the Abrasive Cost/Machine Hour ratio. If increasing the abrasive budget by 500% results in a 10% increase in machine uptime, the ROI is usually instantaneous. In the following sections, we will explore how this machine time is further influenced by the physical G-ratio and the thermal limits of the process.
3. The G-Ratio Myth: Why a Long-Lasting Wheel Might Be Costing You More
In the traditional lexicon of abrasive engineering, the G-Ratio (the volume of material removed divided by the volume of wheel wear) has long been the primary metric for efficiency. A high G-Ratio is instinctively perceived as a sign of economic success. However, in modern high-precision grinding, this is a dangerous oversimplification. A wheel that refuses to wear—often characterized by an excessively hard Grade—can be the most expensive tool in the factory due to its impact on Specific Grinding Energy (us) and the resulting metallurgical damage to the workpiece.
The Physics of Attritious Wear vs. Self-Sharpening
To understand the economic trap of a high G-Ratio, we must look at the grain-level interaction. A grinding wheel is designed to be a self-sharpening system. As the abrasive grains perform work, they develop “wear flats” through Attritious Wear. These flats increase the contact area between the grain and the workpiece, leading to a spike in friction.
If the wheel bond is too strong (a “Hard” wheel), the dull grains are retained on the wheel face. This results in the wheel “rubbing” rather than “shearing” the metal. This rubbing converts mechanical energy into heat, drastically increasing the Energy Partition (Rw)—the percentage of total energy that enters the workpiece. While you are “saving” money on abrasive volume, you are paying for it through increased electrical spindle load, degraded coolant, and, most importantly, the risk of Grinding Burn.
The Economics of “Paying for the Wear”
In a data-driven cost analysis, the “ideal” grinding wheel is one that wears just enough to stay sharp without excessive truing. When a grain fractures or the bond releases it (the Self-Sharpening Mechanism), it is a form of Quality Insurance. By intentionally sacrificing a small percentage of the wheel’s volume, you ensure that the specific grinding energy (us) remains constant and the surface temperatures remain below the critical Ac3 transformation point.
Consider a high-torque EV shaft production line. If a softer, “wearing” wheel costs an additional $2.00 per part in abrasive consumption but allows for a 15% increase in throughput and a 0% scrap rate, the economic ROI is massive. Conversely, a “long-lasting” wheel that saves that $2.00 but induces Tensile Residual Stress creates a latent failure risk that no amount of abrasive savings can justify.
A Hard Truth: “In precision grinding, a wheel that doesn’t wear is a wheel that doesn’t cut. If you aren’t paying the abrasive supplier for a little bit of wear, you are paying the electricity company for friction and the quality department for scrap. The G-Ratio should be a secondary KPI; the Cost-per-Good-Part is the only metric that matters.”
Optimizing the Balance
Achieving the lowest possible TCO requires finding the “Sweet Spot” where the G-Ratio is high enough to minimize truing downtime but low enough to maintain a sharp, cool-cutting wheel face. This is often achieved through Hybrid Bond Systems or Micro-crystalline Ceramic Grains that micro-fracture rather than shattering. In the next section, we will analyze how the lifeblood of this thermal management—the coolant—interacts with this optimized wear to define the final cost structure.
4. Coolant and Filtration: The Hidden Lifeblood of Grinding Economics
In the hierarchy of grinding expenditures, the Metalworking Fluid (MWF) is often categorized as a minor utility cost. This is a critical strategic error. While the initial purchase price of the coolant concentrate may seem negligible, the Total Lifecycle Cost of the fluid—including pumping energy, filtration maintenance, and hazardous waste disposal—can account for up to 15% of the total operating budget. More importantly, the coolant is the primary medium for thermal management. A failure in the coolant strategy directly translates to a failure in the wheel’s performance, leading to a cascade of indirect costs.
The High Price of Poor Filtration
The primary enemy of a precision grinding process is the “re-circulation of swarf.” If the Filtration System fails to remove fine abrasive particles and metallic chips (typically below 5-10 μm), these particles are re-introduced into the grinding zone. This leads to Three-Body Abrasion, which degrades the surface finish (Ra) and causes random “scratches” that result in immediate rework or scrap.
Economically, the cost of a high-precision centralized filtration system is an investment in Process Capability (Cpk). A system that maintains a consistent “cleanliness level” reduces the frequency of wheel dressing by preventing Wheel Loading. When the pores of a wheel are filled with recycled swarf rather than fresh coolant, the friction increases, the specific energy (us) spikes, and the wheel’s effective life is cut short.
Jet Coherency and the “Air Barrier” Problem
A significant portion of grinding energy is wasted simply trying to get the coolant through the high-pressure “air barrier” generated by the rotating wheel. If the Nozzle Design is poor, the coolant bounces off the wheel face without ever reaching the contact zone. This Hydrodynamic Inefficiency requires the shop to increase pump pressures, which consumes excessive electricity and adds heat to the fluid itself—a self-defeating cycle.
Optimizing the nozzle geometry and matching the Jet Velocity (vj) to the Wheel Peripheral Speed (vs) can reduce the total fluid volume required while increasing the cooling efficiency. In high-speed CBN grinding, this precision can reduce the power consumption of the high-pressure pumps by up to 40%, significantly lowering the utility overhead portion of the TCO.
A Field Insight: “Procurement buys coolant by the drum, but the factory pays for it by the kilowatt and the gallon of waste. If you aren’t filtering your coolant to a level that protects your wheel’s topography, you aren’t saving money—you’re just renting clean water before turning it into expensive sludge.”
Biological and Chemical Stability
Finally, the “hidden” cost of coolant involves its chemical maintenance. Uncontrolled bacterial growth and pH shifts can lead to the corrosion of machine components and skin irritation for operators, causing Labor Disruptions. Investing in a robust fluid management program—using sensors to monitor concentration and biological load—ensures that the “lifeblood” of the machine remains an asset rather than a liability. In the next section, we will analyze how the regeneration of the wheel itself—the dressing process—adds the final layer to this complex cost equation.
5. Dressing Dynamics: The Cost of Regeneration
Dressing is the paradoxical necessity of the grinding process. It is the operation required to regenerate the wheel’s topography by removing dull abrasive grains and cleared bond material, yet it is simultaneously the primary cause of wheel consumption. In high-volume production, the Dressing Strategy dictates the balance between quality stability and tool cost. A failure to optimize dressing dynamics often leads to an “over-dressing” culture, where up to 70% of a wheel’s usable volume is removed by the dresser rather than the workpiece.
The Economics of Dressing Frequency (fd)
The Dressing Interval—the number of parts ground between dressing cycles—is a direct lever on the cost-per-part. Every dressing action consumes Non-Productive Time (tnp) and reduces the wheel’s diameter (ds).
Consider a Vitrified CBN wheel used for camshaft grinding. If the dressing lead and depth are set too aggressively to ensure a “safe” surface finish, the wheel’s radial wear per dress might be 5 μm. Over a thousand cycles, this accounts for 5mm of expensive superabrasive layer. By refining the Dressing Overlap Ratio (Ud) and utilizing acoustic emission sensors to detect exactly when the wheel becomes dull, an engineer can extend the dressing interval by 20-30%, which exponentially increases the ROI of the wheel.
The Cost of Diamond Tooling: Dresser Wear
Often ignored in the initial abrasive budget is the Diamond Dresser. In precision grinding, the dresser is the master that defines the wheel’s topography. As the diamond tip wears (developing a “flat”), it produces a “closed” wheel surface with a high Active Cutting Edge Density. While this might improve Rsuba/sub, it drastically increases grinding friction and power consumption.
A worn dresser is a silent cost driver. It forces the operator to dress more frequently to compensate for the wheel’s lack of “bite,” creating a vicious cycle of wheel and diamond consumption. Investing in high-quality CVD (Chemical Vapor Deposition) or MCD (Monocrystalline Diamond) rotary dressers may have a higher upfront cost, but their stable wear characteristics ensure a consistent grinding process, reducing the “Quality Failure” portion of the TCO.
A Hard Lesson: “I’ve seen plants change their grinding wheel supplier three times to solve a burning issue, only to find the culprit was a $200 diamond dresser that had been flat for a month. If you don’t control the tool that controls the wheel, you aren’t managing your costs; you’re just gambling with your production.”
Dressing and Surface Integrity
Finally, the “cost” of dressing includes the metallurgical state of the part. An optimized dressing lead creates an “open” wheel that cuts cool, reducing the risk of Grinding Burn. In the next section, we will examine the most expensive factor of all: the cost of those quality failures when the wheel, coolant, and dressing strategy fail to align.
6. Scrap, Rework, and Inspection: The High Price of Quality Failures
In the final analysis of grinding economics, the most significant cost driver is not what you spend, but what you lose. In precision manufacturing, a grinding operation is typically the last stage of a high-value added process. By the time a part reaches the grinding cell, it has already incurred the costs of raw materials, forging, turning, and heat treatment. Therefore, a single Scrap Part at the grinding stage represents the loss of the cumulative investment of the entire production line. This is the Multiplier Effect of Quality Failure, where a $0.50 saving on a lower-grade wheel can lead to the destruction of a $500 finished component.
The “Invisible” Cost of Grinding Burn
The most insidious form of quality failure is Grinding Burn—a thermal injury that alters the metallurgical state of the subsurface layer. Unlike dimensional errors, grinding burn is often invisible to the naked eye. If the wheel specification and dressing strategy fail to manage the heat flux, the surface undergoes re-tempering (softening) or, in extreme cases, the formation of Untempered Martensite (UTM), also known as “white layer.”
The economic impact of this “invisible damage” is two-fold:
- Direct Inspection Overhead: To mitigate the risk, facilities must implement expensive Non-Destructive Testing (NDT) methods, such as nital etching or Magnetic Barkhausen Noise (MBN) analysis. The labor, chemicals, and cycle time required for 100% inspection add a massive premium to the cost-per-part.
- Liability and Warranty Risk: If a burnt part passes inspection and is installed in an EV drivetrain or an aircraft engine, it acts as a “time bomb.” The tensile residual stresses induced by the burn significantly reduce the fatigue life of the component, leading to catastrophic field failures and global recalls.
The Economics of Rework: A Sunk Cost Fallacy
When a part fails to meet surface finish (Ra) requirements, many facilities attempt to Rework the component. However, the true cost of rework often exceeds the value of the part itself. Rework requires manual intervention, separate machine setups, and disrupts the flow of the entire production cell. Furthermore, the second grinding pass on a rework part often risks over-thinning the case-hardened layer, compromising the metallurgical integrity.
A process that is “stable and capable” (high Cpk) avoids these hidden labor sinks. This stability is achieved by investing in premium abrasives and precise dressing tools that maintain a consistent Active Cutting Edge Topography. In the long run, the “savings” from a cheaper process are virtually always liquidated by the overhead costs of managing non-conforming material.
A Hard Truth: “In the grinding department, your most expensive asset is the ‘Red Bin’ (Scrap). If you spend your day arguing over the price of a wheel while that bin is filling up, you are merely an observer of inefficiency. A zero-defect process is the only truly low-cost process.”
Ultimately, the goal of cost optimization should be to eliminate the need for inspection altogether through In-process Monitoring and stable wheel selection. In the next section, we will analyze the role of energy efficiency and how the specific grinding energy acts as the final arbiter of operational cost.
7. Energy Partition and Specific Grinding Energy: The Price of Power
In an era of rising energy costs and strict ESG (Environmental, Social, and Governance) mandates, the Specific Grinding Energy (us)—the energy required to remove a unit volume of material—has evolved from a purely academic metric to a critical financial KPI. Grinding is one of the most energy-intensive manufacturing processes, characterized by extremely high specific energies compared to turning or milling. This energy is not only a direct utility expense but also the primary driver of thermal degradation in both the machine spindle and the workpiece.
The Components of Grinding Energy
The total energy consumed at the grinding interface is partitioned into three primary mechanisms: Chipping (useful work), Plowing (plastic deformation), and Sliding (pure friction). In an inefficient process, up to 70% of the energy is consumed by sliding and plowing, which generates heat without removing material.
- Frictional Losses: Dull abrasive grains or a “closed” wheel topography lead to excessive sliding. This increases the spindle load, shortening the life of high-precision bearings and requiring more frequent (and expensive) maintenance interventions.
- Energy Partition (Rw): This represents the fraction of the total energy that is conducted into the workpiece. An optimized CBN wheel may have an Rw of 20%, whereas a dull conventional wheel can reach 60-80%, effectively turning the grinding machine into an expensive induction heater.
High-Speed Grinding (HSG) and Economic ROI
Investing in machines capable of High-Speed Grinding (vs > 120 m/s) often comes with a significant CAPEX premium. However, the economic justification lies in the physics of chip formation. As wheel speed increases, the Maximum Uncut Chip Thickness (hcu) decreases, which paradoxically can reduce the specific grinding energy if the feed rate is adjusted proportionally.
Furthermore, higher speeds allow for a dramatic increase in the Material Removal Rate (MRR’), which dilutes the machine overhead cost per part. When evaluating the ROI of a high-speed system, engineers must account for the reduction in “Total Energy per Part.” A faster cycle time not only reduces labor and overhead but also minimizes the time the coolant pumps and chillers must operate, leading to a leaner and more sustainable cost structure.
The Green Shift: “Energy efficiency in grinding is no longer a ‘nice-to-have’ for the marketing brochure. It is a fundamental part of the TCO. If your process is drawing 50kW of spindle power just to rub a part into compliance, you are wasting profit on every revolution. Efficiency is the ultimate form of cost avoidance.”
In conclusion, the energy signature of the grinding process is the final arbiter of its economic health. By minimizing the specific energy through sharp abrasives and optimized kinematics, we reduce both the direct electricity bill and the indirect costs of thermal instability. In the final section, we will synthesize these hidden factors into a strategic framework for TCO optimization in the modern era.
8. Conclusion: Strategic TCO Optimization for the EV Era
Throughout this technical analysis, we have demonstrated that the economics of grinding are governed not by the acquisition price of the tool, but by the efficiency of the Abrasive-Workpiece Interface. As the manufacturing sector enters the EV and aerospace-intensive era, the margin for process variability has narrowed to near-zero. The hidden factors we have dissected—machine overhead, dressing frequency, coolant filtration, and energy partition—collectively reveal that a low-cost, low-performance grinding strategy is an unsustainable burden on the corporate balance sheet.
Shifting the Paradigm: From Tool Price to Value-Added Time
True cost leadership in precision grinding is achieved through the maximization of Machine Uptime and First-Time-Through (FTT) Yield. When procurement and engineering departments align their KPIs toward the Total Cost of Ownership (TCO), the focus shifts from saving pennies on grit to saving dollars on cycle time. A high-performance Vitrified CBN wheel or a ceramic-seeded conventional abrasive is not an “expense”; it is a high-yield investment that pays dividends in the form of reduced labor utilization, lower energy consumption per part, and the elimination of the “Red Bin” culture.
The Future: Data-Driven Cost Mastery
Looking forward, the competitive edge will belong to those who treat grinding data as an economic asset. By monitoring Specific Power (P’s) and Force Ratios in real-time, facilities can move from fixed-interval dressing to Condition-Based Dressing, further slashing hidden costs. The integration of AI-driven process monitoring will ensure that the wheel’s specification is perfectly matched to the dynamic state of the machine, resulting in a state of Mechanical Permanence where every part produced is a good part.
Final Summary: “Grinding costs vary widely because many shops are still managing the process with 20th-century accounting logic. In the 21st century, the ‘cheapest’ process is the one with the highest Energy Efficiency, the lowest Downtime, and the absolute Metallurgical Integrity. If you master these hidden factors, the price of the wheel becomes an irrelevant footnote in a story of massive profitability.”
In conclusion, optimizing grinding costs requires a courageous departure from the status quo. It demands a holistic understanding of the thermo-mechanical laws that govern the tool-part interface. By addressing the invisible giant of overhead and the silent killer of quality failure, manufacturers can unlock a new level of operational excellence, ensuring that their grinding cells remain profit centers rather than cost sinks.
References & Internal Technical Resources
Primary Engineering & Economic References
- • Malkin, S., & Guo, C. (2008). Grinding Technology: Theory and Applications of Machining with Abrasives. Industrial Press Inc. (The definitive source for Energy Partition and Specific Grinding Energy models).
- • Rowe, W. B. (2014). Principles of Modern Grinding Technology. Academic Press. (Comprehensive breakdown of thermal damage, fluid dynamics, and process economics).
- • Tawakoli, T. (1993). High Efficiency Deep Grinding. VDI-Verlag. (Focus on increasing MRR’ to dilute machine overhead costs).
- • Marinescu, I. D., et al. (2015). Handbook of Machining with Grinding Wheels. CRC Press. (Data on G-ratio optimization and dressing dynamics).
Internal Deep-Dive Series: Mastering the Cost Drivers
To implement the TCO optimization strategies discussed in this report, please refer to the following specialized technical modules from our roadmap:
Note on Implementation: The economic models presented in this report assume a baseline machine rigidity and stable thermal environment. Actual TCO savings will fluctuate based on specific material removal requirements and individual plant overhead structures. It is highly recommended to perform a Specific Energy Audit (as detailed in Chapter 7) to establish a baseline for energy partition (Rw) before initiating major abrasive substitution programs.