1. Introduction: The Hidden Financial Liability of Burn
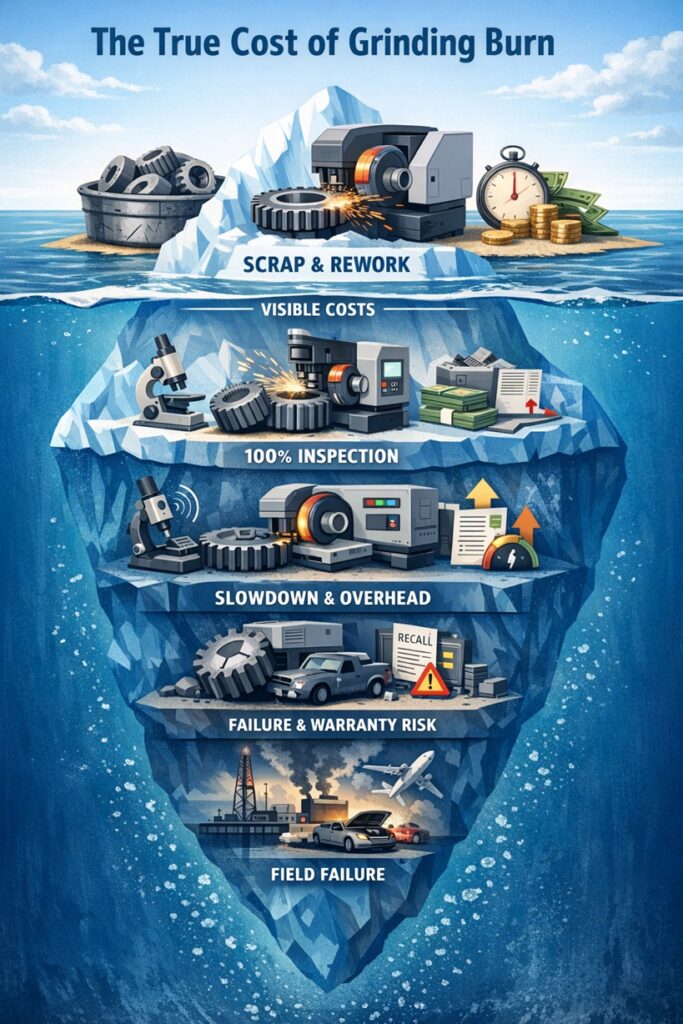
In the high-precision world of abrasive machining, Grinding Burn is often treated as a binary quality metric: a part is either accepted or rejected based on visual inspection or nital etching. However, for the modern manufacturing enterprise, this “binary” view is a dangerous oversimplification that masks a massive financial liability. The true cost of thermal damage is rarely limited to the immediate value of the scrapped workpiece. Instead, it represents a complex Cost of Quality (COQ) iceberg, where the visible scrap costs are merely the tip, while the catastrophic expenses of inspection bottlenecks, reliability failures, and warranty claims remain submerged and unquantified.
The “Iceberg” Effect of Thermal Damage
When a grinding process exceeds the Critical Temperature Threshold of the workpiece material, the resulting metallurgical injury—thermal damage—permanently alters the surface integrity. In industries such as aerospace, automotive driveline, and renewable energy (wind turbine gearing), a single burned tooth or bearing race can lead to catastrophic system failure.
The financial impact of a burn event ripples through the organization in three distinct waves:
- Direct Sunk Costs: The immediate loss of raw material, labor hours, and machine overhead accumulated up to the point of rejection.
- Systemic Operational Costs: The massive burden of 100% inspection, the slowing of the production cadence, and the energy waste associated with non-conforming parts.
- Future Liability Costs: The unquantified risk of Tensile Residual Stress leading to fatigue failure in the field, potentially triggering multi-million dollar recalls or brand equity erosion.
Defining the Physical and Economic Boundary
Economically quantifying burn requires a deep understanding of Energy Partitioning (Rw). When the grinding energy is not efficiently removed by the chips or the coolant, it is conducted into the part, raising the surface temperature (T) above the material’s tempering or rehardening point. From a financial perspective, Rw is the “Efficiency Tax” on the process. A process with a high Rw is inherently high-risk; it is a process operating on the edge of financial insolvency due to its narrow Process Window.
Purpose of this Economic Framework
The objective of this report is to bridge the gap between Thermal Engineering and Financial Management. By the conclusion of this analysis, we will have established a robust methodology for quantifying the “Real Cost” of a burn event. This data enables leadership to make informed decisions: for instance, recognizing that a $50,000 investment in advanced Acoustic Emission (AE) monitoring is not an expense, but an insurance policy that pays for itself by preventing just one localized batch rejection.
Executive Insight: “In precision manufacturing, quality is not a luxury—it is the ultimate cost-saving measure. A part that is 99% complete but thermally damaged is not a 99% asset; it is a 100% liability with negative value.”
In the following chapter, we will dissect the Physics of Grinding Burn, analyzing how energy partition (Rw) dictates the financial risk of every spark produced on the factory floor.
2. The Physics of Grinding Burn and Energy Partition
To quantify the financial loss associated with thermal damage, one must first master the physics of the Grinding Contact Zone. Grinding is characterized by an extremely high Specific Grinding Energy (us), where a vast majority of the mechanical work is converted into thermal energy. The critical question for both the engineer and the accountant is not how much energy is consumed, but where that energy goes. This is defined by the Energy Partition (Rw)—the ratio of the total grinding energy that enters the workpiece. When Rw exceeds a specific threshold, the localized temperature (T) surpasses the material’s phase transformation point, leading to what is industrially known as “Burn.”
Thermal Mechanisms: Tempering vs. Rehardening
Thermal damage in ferrous metals typically manifests in two distinct metallurgical stages, each carrying different levels of risk and cost:
- Over-tempering (Softening): Occurs when the surface temperature exceeds the original tempering temperature of the steel but remains below the Austenitization Temperature (Ac1). This results in a localized reduction in hardness, significantly compromising the wear resistance of components like bearing races or cam lobes.
- Rehardening (Martensitic Burn): Occurs when the peak temperature surpasses the Ac3 line, followed by rapid quenching by the coolant or the cold bulk of the part. This creates a brittle layer of “Untempered Martensite” (UTM), which is highly susceptible to micro-cracking and sudden fatigue failure.
The Energy Partition Model (Rw) as a Risk Metric
The Energy Partition is the “Thermal DNA” of a grinding process. It dictates the maximum temperature (Tmax) reached at the surface according to the following analytical relationship:
Tmax ∝ (Rw × us × vw × ae1/2)
In conventional grinding with Aluminum Oxide wheels and water-based fluids, Rw can be as high as 60% to 85%. In contrast, utilizing Cubic Boron Nitride (CBN) wheels—which possess superior thermal conductivity—can drop Rw to below 20%. From a cost perspective, a high Rw represents an unstable process with a narrow margin for error. A slight fluctuation in coolant pressure or wheel sharpness can instantly push the temperature into the “Scrap Zone,” resulting in an immediate 100% loss of the part’s value.
Residual Stress: The Invisible Debt
Even in the absence of visible discoloration (Oxidation Burn), thermal energy creates Tensile Residual Stresses. Ideally, a grinding process should induce Compressive Residual Stresses, which enhance fatigue life by “closing” potential cracks. However, when the thermal expansion of the surface is constrained by the cooler core and subsequently shrinks upon cooling, the surface is left in a state of tension.
Mathematically, tensile stress reduces the endurance limit of the part according to Goodman’s Rule. Economically, this tensile stress is a “debt” that the part carries into the field. It is a hidden defect that does not show up on a standard micrometer but manifests as a catastrophic failure after 10,000 cycles of operation. The cost of this invisible debt is the most difficult to quantify but is often the most devastating to a company’s reputation and warranty reserves.
The Physicist’s Perspective: “Heat is the enemy of precision. In grinding, every Joule of energy you cannot account for in the chip or the coolant is a potential failure point. Mastering Rw is the only way to transform an unpredictable craft into a measurable financial asset.”
In the next chapter, we will shift from the microscopic physics of heat to the macroscopic reality of the factory floor: Quantifying Visible Scrap Costs and the direct material losses incurred by thermal instability.
3. Quantifying Visible Scrap Costs: The Direct Financial Impact
When a high-precision component is rejected due to Grinding Burn, the financial loss is far more than the price of a piece of raw steel. In the sequence of manufacturing, grinding is typically one of the final operations—meaning that a “Burned” part carries with it the cumulative cost of every preceding process. To accurately quantify Visible Scrap Costs, a facility must account for the total “Sunk Value” embedded in the component at the moment the thermal injury occurs. This includes not only the material and direct labor but also the dissipated energy and the lost opportunity for machine utilization.
The “Cumulative Value” Trap in Finishing Operations
In the production of an aerospace turbine shaft or an EV reduction gear, the grinding stage often happens after expensive processes like Vacuum Heat Treatment, Carburizing, and Hard Turning. If a part is scrapped at the grinding stage, 100% of the value added in these previous steps is instantly destroyed.
Mathematically, the direct scrap cost (Cscrap) for a single unit can be modeled as:
Cscrap = Cmat + ∑(Cproc_i + Clabor_i + Coverhead_i)
where Cmat is the raw material cost and the summation represents all processes from forging to final grinding. Because grinding is the “Value Peak,” the cost of a scrap event here is often 10 to 20 times higher than a scrap event during the initial rough turning phase. In a high-volume line, a 1% scrap rate at the grinding station can erode the entire annual profit margin of a product family.
Machine Overhead and “Shadow Labor”
Beyond material and labor, the Machine Overhead Rate (Cm)—which includes machine depreciation, floor space, and maintenance—must be factored into the scrap cost. If a CNC grinder with a rate of $250/hour spends 45 seconds grinding a part that is ultimately scrapped due to burn, that $3.12 of machine time is a pure loss.
Furthermore, there is the cost of “Shadow Labor.” This involves the time spent by operators, quality technicians, and material handlers in identifying, tagging, and moving the non-conforming material (NC) to the scrap bin. In many plants, the administrative cost of processing a scrap report exceeds the value of the material itself. This inefficiency effectively lowers the Overall Equipment Effectiveness (OEE) by consuming productive capacity for the generation of waste.
Dissipated Energy and Tooling Amortization
We must also consider the Specific Grinding Energy (us) consumed in the creation of the scrap part. If the process was running inefficiently—with a high Rw—it likely consumed more energy than necessary to produce the burn. This energy, along with the volume of Superabrasive (CBN) or Diamond Dresser worn away during the cycle, must be added to the total loss.
In a 24/7 production facility, these “micro-losses” from energy and tooling amortization on scrap parts can sum to tens of thousands of dollars annually per machine. The true tragedy of a burn event is that the machine spent its finite life and consumed expensive resources to produce an object with zero market value—or worse, an object that poses a liability risk.
The Cost Accountant’s Axiom: “The most expensive part you will ever make is the one you have to throw away at the very last step. Grinding burn is not just a surface defect; it is the instantaneous incineration of the last 10 hours of your factory’s hard work.”
In the following chapter, we will look beyond these visible losses and analyze the even more crushing Burden of Quality Assurance (QA) & Inspection, where the cost of finding the burn can often exceed the cost of the scrap itself.
4. The Burden of Quality Assurance (QA) & Inspection
If the direct scrap cost is the visible peak of the iceberg, the Burden of Quality Assurance (QA) is the massive, submerged structure that destabilizes a factory’s profitability. Once a grinding burn is detected in a batch, the immediate reaction of the quality department is typically the implementation of 100% inspection protocols. This reactive shift transforms the inspection process from a statistical safeguard into a massive operational bottleneck. The cost of “proving the part is good” can, in many high-precision sectors, rival the actual cost of manufacturing the part itself.
Non-Destructive Testing (NDT) OPEX: Nital Etching and Barkhausen Noise
Detection of thermal damage is inherently difficult because it often occurs at the microstructural level without significant dimensional change. To quantify this, facilities must invest in specialized NDT technologies:
- Nital Etching: A chemical process using nitric acid and alcohol to reveal tempering and rehardening. While effective, it is a manual, messy, and environmentally hazardous process. The costs include chemical disposal, labor for manual scrubbing/dipping, and the mandatory rust-prevention steps that must follow.
- Barkhausen Noise (BN) Analysis: An electromagnetic technique that measures the “magnetic noise” generated during domain wall movement. While faster and cleaner than etching, BN systems require significant capital investment (often $50,000 to $150,000) and highly trained technicians to interpret the RMS signals and peak frequency shifts.
The Economics of the Bottleneck: Throughput vs. Compliance
The most devastating cost of 100% inspection is the loss of Throughput. If a CNC grinder produces a part every 60 seconds, but the inspection station requires 120 seconds per part, the entire production line’s capacity is effectively halved. This is known as a QA-Induced Bottleneck.
Economically, this loss of capacity is a massive opportunity cost. If the facility cannot fulfill orders due to inspection delays, they face late-delivery penalties and potential loss of future contracts. In this scenario, the cost of the burn is not the $100 scrapped part, but the $5,000 per hour in lost revenue from the machine being starved of capacity by the downstream inspection lag.
False Positives: The Cost of Over-Detection
There is also the hidden financial drain of False Positives. When a process is known to be “burn-prone,” quality inspectors often become hyper-conservative. Parts with minor, non-functional surface anomalies or variations in background magnetic noise are often scrapped “just to be safe.”
Empirical data suggests that in 100% inspection environments, up to 15% of the “scrapped” parts are actually perfectly functional but fall victim to Detection Uncertainty. This over-rejection is a pure financial waste that could be eliminated by stabilizing the grinding process at the source rather than relying on fallible end-of-line checks.
QA Manager’s Takeaway: “Inspection is not a value-added process; it is a cost of failure. The goal of any zero-burn roadmap should be to move inspection into the grinding zone via real-time sensors, effectively turning ‘Quality Control’ into ‘Process Control’ and reclaiming the wasted hours of the NDT lab.”
In the following chapter, we will discuss the difficult decision-making process between Rework vs. Scrap, and the financial decision matrix used to determine if a thermally damaged part can truly be saved.
5. Rework vs. Scrap: The Economic Decision Matrix
When a localized grinding burn is detected, the manufacturing team faces a critical crossroads: immediate disposal (Scrap) or attempted recovery (Rework). While the instinctive reaction is often to “save the part” to protect the yield metrics, this decision is frequently made without a rigorous Total Cost Analysis. Reworking a thermally damaged component is not a simple “redo”; it is an additional, high-risk operation that consumes further resources and may ultimately result in a part that meets dimensional tolerances but remains metallurgically compromised.
The Feasibility of Rework: Depth of Injury vs. Tolerance
The technical feasibility of rework depends entirely on the Depth of the Thermal Damage (dt) compared to the remaining Grinding Allowance (ag). If a burn penetrates 50 μm into the surface, but the final tolerance only allows for another 20 μm of material removal, the part is technically unrecoverable.
Attempting to “grind out” a burn often leads to a phenomenon known as Burn Migration. Because the original burn was caused by a dull wheel or poor lubrication, adding a second pass with the same sub-optimal parameters will likely induce a second, deeper burn. Thus, rework requires a radical change in kinematics—lower feed rates, increased coolant flow, and fresh dressing—all of which increase the Variable Processing Cost of a part that is already financially underwater.
The Financial Decision Function
To determine the viability of rework, managers should utilize a Recovery ROI Function:
RROI = (Valuefinal – Crework) > (Cscrap × Pfailure)
where Crework is the cost of additional machine time and NDT, and Pfailure is the probability that the reworked part will still fail final inspection. In many high-precision automotive lines, the Crework is so high—due to the specialized setup and slow feed rates required—that it actually exceeds the cost of simply starting a new part from the forging stage.
The “Hidden” Cost of Rework: Logistical Chaos
Beyond the direct machine time, rework introduces Logistical Friction. Non-conforming parts must be pulled from the standard flow, tagged, and often moved to a secondary “rework station” or wait for a gap in the production schedule. This disrupts the Lean Manufacturing principle of Single-Piece Flow and increases the Work-in-Progress (WIP) inventory. The administrative cost of tracking these “zombie parts” and the risk of them being accidentally mixed with good inventory (Mixed Material Risk) is a significant indirect cost that is almost never captured in the shop floor’s scrap report.
The Lean Strategist’s Advice: “Rework is often an ego-driven decision to avoid reporting a scrap event. In reality, a fast scrap and a root-cause fix are cheaper than a slow, complex rework that clogs your system and leaves a lingering doubt about the part’s integrity.”
In the following chapter, we will address the most dangerous financial risk of all: the Long-term Reliability & Warranty Liabilities that occur when a burn goes undetected and the part enters service.
6. Long-term Reliability & Warranty Liabilities: The Financial Time Bomb
The most terrifying financial risk associated with grinding burn is not the part that is scrapped in the factory, but the part that is mistakenly shipped to the customer. When thermal damage goes undetected—either due to localized “micro-burns” or inadequate NDT protocols—it enters the service life as a functional component with a hidden defect. This is the “Financial Time Bomb” of precision manufacturing. While the part may meet all dimensional tolerances, its internal metallurgical state is in a condition of Premature Fatigue Failure, waiting for the right combination of operational stress and time to trigger a catastrophic event.
Fatigue Life Erosion: Tensile Stress vs. Service Cycles
The primary mechanism of field failure in burned components is the drastic reduction in Fatigue Strength. High-performance components, such as transmission gears or aerospace bearings, rely on a surface layer of Compressive Residual Stress to inhibit crack initiation. Grinding burn flips this state into Tensile Residual Stress.
Empirical studies on case-hardened steels indicate that even a “mild” over-tempering burn can reduce the fatigue limit by 30% to 50%. In rotating machinery, this means a component designed for a 15-year service life may fail in less than 3 years. From a warranty perspective, this is a disaster; it ensures that the failure will occur well within the manufacturer’s liability period, leading to a 100% claim rate for the affected batch.
The Exponential Cost of Field Recalls
The cost of a quality failure follows a Power Law: as the part moves further down the supply chain, the cost to rectify a defect increases tenfold at each stage.
- In-Process (Grinding Station): Cost is limited to scrap and rework ($100 – $500).
- Assembly Line (OEM): Cost includes tear-down of the entire engine or gearbox ($5,000 – $15,000).
- Field Service (Customer): Cost includes logistics, labor, legal liability, and brand damage ($100,000 – $1,000,000+).
In the automotive industry, a “Burn Batch” of just 1,000 transmission shafts can trigger a Safety Recall. The cost of such a recall includes not only the physical replacement of parts but also the legal fees associated with potential accidents caused by component failure. For a mid-sized OEM, a single major recall due to grinding burn can wipe out an entire year’s net profit and lead to a significant drop in Market Capitalization.
Brand Equity and the “Silent Cost”
Beyond the balance sheet, there is the Erosion of Trust. In Tier-1 supply chains, being identified as a “Burn-Prone Supplier” can lead to a downgrade in supplier rating, resulting in the loss of future bidding opportunities. This “Silent Cost” is perhaps the most damaging; it represents the loss of Future Revenue Streams that are never realized because the customer no longer trusts the metallurgical integrity of your grinding process. For high-tech manufacturing, your reputation for surface integrity is your most valuable Intangible Asset.
Risk Management Insight: “Detection is a failure of prevention. The goal of burn management is not to find every burned part, but to create a process so stable that burn becomes statistically impossible. In the world of field liabilities, an ounce of prevention at the spindle is worth a ton of lawyers in the courtroom.”
In the following chapter, we will shift toward the solution: Optimization Strategies to Mitigate Burn Costs, focusing on the high-ROI investments in abrasives and monitoring that prevent these catastrophic financial outcomes.
7. Optimization Strategies to Mitigate Burn Costs: The ROI of Prevention
To stop the bleeding of Scrap Costs and QA Burden, a manufacturing facility must transition from a “detection-based” quality model to a “prevention-based” engineering model. Mitigating the financial impact of grinding burn requires a strategic alignment of hardware, software, and process kinematics. While these optimizations often require an initial Capital Expenditure (CAPEX), their ability to stabilize the Operational Expenditure (OPEX) by eliminating non-conforming parts creates an overwhelming Return on Investment (ROI). This chapter analyzes the primary technical levers that act as financial safeguards against thermal damage.
Abrasive Upgrades: CBN and Engineered Ceramics as Insurance
The most effective way to lower the Energy Partition (Rw) and prevent burn is to reduce the friction at the contact zone. Upgrading from conventional Aluminum Oxide (Al2O3) to Superabrasives (CBN) or Engineered Micro-crystalline Ceramics is the most direct path.
CBN possesses a thermal conductivity nearly 40 times higher than conventional abrasives. Instead of heat being trapped in the workpiece, the CBN crystals conduct it back into the wheel and away through the coolant. From a financial perspective, if a $10,000 CBN wheel reduces the scrap rate from 2.5% to 0.1% in a high-value automotive line, the wheel pays for itself in less than three months. The higher purchase price is not a cost; it is an Asset Preservation Strategy.
Real-Time Monitoring: Eliminating the Lag in Quality Control
The traditional method of checking for burn *after* the process is complete creates a “Quality Lag” that can lead to large batches of defective parts before the issue is caught. Implementing In-process Monitoring—specifically Acoustic Emission (AE) and High-Frequency Spindle Power Analysis—allows for the detection of burn the moment it happens.
When an AE sensor detects the high-frequency elastic waves associated with Martensitic Transformation, it can trigger an immediate “Emergency Stop” or a “Wheel Dress” cycle. By stopping the process the instant a single part is damaged, the facility prevents an entire shift’s production (often worth $50,000+) from being quarantined. The ROI for an AE sensor system (typically $15,000 per machine) is realized the first time it prevents a batch rejection.
Coolant Hydrodynamics: Targeted Heat Evacuation
Often, the cause of burn is not the lack of coolant volume, but the failure of the coolant to enter the Grinding Contact Zone. As wheel speeds (vs) increase, the air barrier surrounding the wheel prevents the fluid from reaching the interface. Investing in Coherent Jet Nozzles and 3D-printed manifolds that match the wheel’s velocity profile is a high-ROI tactic.
By ensuring that 100% of the coolant flow is utilized for heat evacuation rather than just “splashing” on the part, the facility can maintain a stable surface temperature even during aggressive Roughing Cycles. This allows for an increase in the Material Removal Rate (MRR’) without increasing the scrap risk, effectively diluting the machine overhead cost per part.
The Optimization Insight: “In the battle against burn, technology is your most profitable ally. A facility that relies on ‘operator feel’ to prevent burn is essentially gambling with its annual profit margin. A facility that relies on CBN, AE monitoring, and coherent coolant jets is building a fortress of predictable profitability.”
In the final chapter, we will synthesize these findings into a Conclusion: Strategic Roadmap for Zero-Burn Manufacturing, providing a final analysis of why mastering the “Real Cost of Grinding Burn” is the ultimate competitive advantage.
8. Conclusion: Strategic Roadmap for Zero-Burn Manufacturing
As we have analyzed throughout this report, the financial impact of Grinding Burn is not a mere line item on a scrap report; it is a profound operational liability that erodes the very foundations of manufacturing profitability. The “Real Cost” of thermal damage encompasses the immediate loss of sunk value, the staggering burden of inspection bottlenecks, and the existential threat of long-term field failures. In the modern manufacturing landscape—defined by hyper-competitive margins and stringent safety standards—the ability to eliminate burn is no longer a quality goal; it is a Strategic Necessity.
The Synthesis of Total Cost: Why Prevention Pays
When we quantify the “Real Cost,” we find that a single burned part in a high-value automotive or aerospace line can cost the organization between 10x and 100x its original manufacturing price when secondary inspection and logistical friction are included. This multiplier increases exponentially if the defect reaches the field. Therefore, the return on investment for Zero-Burn Technology—such as high-performance CBN wheels, AE monitoring, and optimized dressing protocols—is among the highest in the industrial sector.
By reducing the Energy Partition (Rw) and stabilizing the process window, a facility doesn’t just “save a part”; it reclaims lost capacity, eliminates chemical waste from NDT labs, and secures the brand’s reputation for metallurgical excellence.
A Step-by-Step Roadmap to Cost Leadership
To achieve a “Zero-Burn” status, organizations must implement a phased transformation of their grinding operations:
- Step 1: Thermal Auditing. Utilize power monitoring and thermal modeling to identify “High-Risk” processes where the specific grinding energy (us) is nearing critical thresholds.
- Step 2: Hardware Stabilization. Upgrade to high-conductivity abrasives (CBN) and high-precision coolant delivery systems to lower the Rw at the source.
- Step 3: Digital Transformation. Integrate Acoustic Emission (AE) and spindle load sensors for real-time, closed-loop control, moving from “Detection” to “Autonomous Prevention.”
- Step 4: NDT Elimination. As the process reaches Cpk values > 1.67 for thermal stability, reduce the reliance on expensive Nital Etching in favor of statistical sampling and digital monitoring data.
Final Proclamation: Quality as a Financial Engine
In conclusion, the mastery of the Real Cost of Grinding Burn is the ultimate competitive edge. By shifting the focus from “how much a wheel costs” to “how much a burn event costs,” management can justify the investments required to modernize the shop floor. In the end, a part that is ground cold, fast, and sharp is the most profitable part you can produce. Zero-Burn is not just a quality standard; it is the most powerful financial engine in your factory.
The Final Vision: “A factory that understands the physics of heat understands the economics of profit. By eliminating the ‘invisible debt’ of thermal damage, we transform our manufacturing process from a source of liability into a beacon of reliability and cost leadership.”
Mastering the thermal integrity of the grinding process is the final frontier in the quest for operational excellence. By implementing the roadmap outlined in this study, manufacturers can secure their future in an industry where precision and profitability are inseparable.
© 2026 Precision Quality Economics Group | Thermal Integrity Series
References & Internal Technical Resources
Primary Engineering & Scientific References
- • Malkin, S., & Guo, C. (2008). Grinding Technology: Theory and Applications of Machining with Abrasives. Industrial Press Inc.
- • Rowe, W. B. (2014). Principles of Modern Grinding Technology. Academic Press.
- • Tawakoli, T. (1993). High Efficiency Deep Grinding. VDI-Verlag.
Internal Deep-Dive Series: Mastering Surface Integrity
To implement the Zero-Burn roadmap and mitigate the financial risks detailed in this report, please refer to these specialized technical modules from our grinding series: