1. Introduction: The Mirage of Dimensional Compliance and the Crisis of Data Trust
In the hierarchy of modern precision manufacturing, grinding is often the final arbiter of quality. It is the process entrusted with achieving sub-micron tolerances and mirror-like finishes. However, a profound Data Reliability Crisis is emerging on high-tech shop floors. Production engineers frequently find that “Published Data”—the feed rates, speeds, and tool life estimates provided by wheel manufacturers or academic catalogs—fails to manifest in actual production environments. This discrepancy leads to a dangerous Quality Paradox: a component can pass every dimensional inspection with a high Cpk, yet harbor invisible metallurgical damage that ensures catastrophic failure in the field.
The Fallacy of “Green Light” Manufacturing
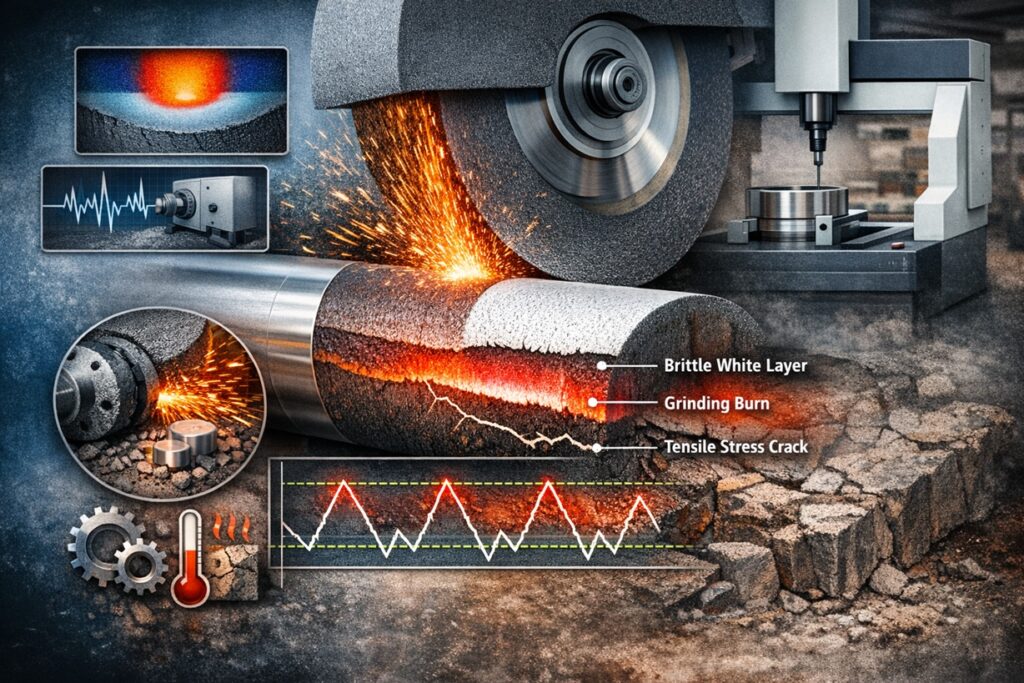
Traditionally, “Process Capability” has been synonymous with “Dimensional Stability.” If the micrometer shows the diameter is within the 6σ band, the process is signaled as capable. But in high-stress grinding, this is a mirage. The most significant threat to yield is not a 2-micron deviation in size, but the Thermal Debt accumulated during the material removal Mechanism. When a process is not thermally anchored, the extreme temperatures in the contact zone can trigger phase transformations, leading to re-tempering or the formation of brittle untempered martensite, known as “White Layer.”
These defects represent a Latent Failure Risk that can decimate yield during final NDT (Non-Destructive Testing) or, even worse, during the component’s operational life. A process with a high dimensional Cpk but a low thermal stability margin is not a capable process; it is a liability. Mastering the “Why” behind these fluctuations is the only path to a zero-defect production environment, necessitating a shift from simple measurement to Abrasive Physics.
Integrating Statistics with Physics: The Mechanism of Discrepancy
Why does published data fail so consistently? The gap lies in the exclusion of real-world variables. Lab-generated data is often produced under “Infinite Stiffness” conditions. In production, however, the Specific Grinding Energy (us) is heavily influenced by the machine’s dynamic compliance and the intermittent efficiency of the coolant jet.
If the production machine lacks the rigidity of the lab tester, the actual power consumed (Pc) increases due to vibration and friction, driving the Thermal Flux beyond the predicted limits. This fundamental mismatch is why a “proven” recipe from a catalog can result in burnt parts and ruined tool life in a factory setting. True yield is the natural byproduct of a process designed to stay within the thermal limits of the material, not just the tolerance limits of the blueprint.
The Trust Axiom: “Data reliability in grinding is not found in a static catalog; it is earned through the synchronization of machine physics and metallurgical limits. To predict tool life accurately, one must first master the thermal Mechanism that governs the tool’s interaction with the steel.”
2. Statistical Foundations: Cp vs. Cpk in the Abrasive Context
Statistical Process Control (SPC) provides the mathematical language to describe manufacturing stability. However, applying these metrics to grinding requires an understanding of the Abrasive Life Cycle. Unlike turning or milling, where tool geometry remains relatively static until failure, a grinding wheel is a “self-sharpening” tool that constantly changes its diameter and topography. This inherent instability makes the calculation of Cp and Cpk a dynamic challenge, as the standard deviation (σ) and the mean (μ) are under constant pressure from mechanical and thermal drift.
Decoding Cp: The Potential of the Machine Architecture
Cp (Process Capability) measures the “Potential” of the system—the width of the process spread relative to the tolerance width, assuming the process is perfectly centered. It is calculated as:
In grinding, σ (Standard Deviation) is primarily driven by the Mechanism of System Rigidity and Vibration. If a machine bed lacks damping or the spindle bearings have excessive run-out, the “scatter” of the dimensions will be wide, resulting in a low Cp. To achieve a high Cp (typically > 1.66), the mechanical foundation must be rock-solid, ensuring that the only variations remaining are the predictable ones, such as grain wear.
Decoding Cpk: The Reality of Geometric and Thermal Drift
While Cp tells you what the machine could do, Cpk (Process Capability Index) tells you what it is doing. It accounts for the centering of the process mean (μ). In grinding, μ is a moving target due to Wheel Wear. As the wheel diameter (ds) decreases, the process mean naturally drifts toward one of the tolerance limits.
If a process has a high Cp but a low Cpk, it indicates a Centering Problem. In grinding, this is usually caused by inadequate Compensation Logic. If the dresser does not accurately update the CNC with the new wheel diameter, or if the spindle grows due to thermal expansion (a Mechanism of heat-induced structural shift), the mean (μ) will shift, narrowing the “Safety Margin” and increasing the risk of producing out-of-tolerance parts.
The “Sawtooth” Stability Pattern
Grinding stability often follows a Sawtooth Pattern. The process mean starts near the center, drifts as the wheel wears (increasing the variance), and is “snapped” back to center by a dressing cycle. The key to high yield is ensuring that the “peaks” of this sawtooth never cross the Control Limits. High-yield manufacturers achieve this by:
- Deterministic Dressing: Scheduling dressing based on the precise volume of material removed (Q’w) rather than time.
- Thermal Stabilization: Running the machine until it reaches steady-state equilibrium before measuring for Cpk studies.
The Statistical Axiom: “A high Cp is a gift from the machine builder, but a high Cpk is a reward for the engineer’s vigilance. In grinding, you cannot have one without managing the physical Mechanism of the other.”
3. The Thermal-Mechanical Gap: Why Published Data Often Fails
The primary reason for the failure of published grinding data in a production environment is the Environmental Discrepancy. Most technical specifications provided by abrasive manufacturers are derived from highly controlled laboratory settings—environments where machine stiffness is near-infinite and coolant delivery is optimized beyond what is feasible on a standard shop floor. This creates a “Reliability Gap” where the theoretical tool life and the actual yield diverge sharply due to unmapped physical Mechanisms.
The Boundary Layer Mechanism: The Invisible Barrier
One of the most critical Mechanisms ignored by published data is the Air-Knife Effect. A grinding wheel rotating at high peripheral speeds (vs) carries a boundary layer of air that acts as a pneumatic barrier. In a lab, high-pressure coherent jets are used to pierce this layer. However, in production, pump degradation or poor nozzle positioning often results in the coolant being deflected.
When the coolant fails to penetrate the contact zone, the Energy Partition (Rw)—the fraction of total grinding energy that enters the workpiece as heat—increases dramatically. While a catalog might assume an Rw of 60% for a given vitrified wheel, a compromised coolant Mechanism can push this to 85%, leading to premature thermal softening and a total collapse of predicted tool life.
Structural Compliance and the Friction Mechanism
Laboratory machines are designed for maximum Static and Dynamic Stiffness. In contrast, production machines possess a finite Compliance (Cm). When the grinding force (Fn) is applied, the machine structure deflects. This deflection alters the Actual Depth of Cut (ae, act) compared to the Programmed Depth of Cut (ae, prog).
As the machine flexes, the Mechanism of material removal shifts from efficient “cutting” to inefficient “plowing” and “rubbing.” Rubbing generates purely frictional heat without removing material, which artificially inflates the Specific Grinding Energy (us). Because published data rarely accounts for the specific Cm of your shop floor equipment, the tool life models become inherently untrustworthy, as they underestimate the thermal load generated by structural non-rigidity.
The Material Composition Variance
Finally, the Mechanism of chemical interaction between the abrasive grain and the workpiece is a variable that published data treats as a constant. A catalog might list data for “AISI 4340 steel,” but the precise metallurgical state—its prior heat treatment, grain size, and trace element concentrations—can alter its Grindability Index. Minor increases in chromium or nickel content can lead to rapid Chemical Wear of the abrasive grains, a Mechanism that accelerates Attritious Wear and renders laboratory-based life predictions obsolete within hours of production start.
The Gap Axiom: “The failure of published data is not a failure of the data itself, but a failure to account for the Mechanism of the environment. A tool life model is only as reliable as the machine’s ability to replicate the laboratory’s thermal and structural stability.”
4. Wheel Wear and Life-cycle: The Physics of Deception
In the quest for high production yield, the “Tool Life” metric is often treated as a linear constant in published data. However, the Mechanism of abrasive wear is fundamentally non-linear and deceptive. A grinding wheel does not simply “dull”; it undergoes a complex evolution of its topography that alters the Specific Grinding Energy (us) and thermal stability of the process. When production data relies on oversimplified life-cycle models, the result is a sudden collapse of Cpk and unexpected batch rejection.
The Attritious Wear Mechanism vs. Bond Fracture
Data reliability is most often compromised by a misunderstanding of the Attritious Wear Mechanism. As the abrasive grains engage the workpiece, they develop “wear flats”—microscopic flat areas on the tips of the grains. This increases the contact area between the grain and the material, shifting the energy consumption from efficient “chip formation” to parasitic “friction.”
If the wheel is too “hard” (high bond retention), the Mechanism of Self-Sharpening (bond fracture) fails to occur. The wear flats continue to grow, causing the Specific Grinding Force (F’n) to escalate. Published data often calculates tool life based on volume removed (V’w), but in production, the tool life “ends” much sooner when the thermal flux from these wear flats exceeds the material’s tempering threshold, long before the wheel is physically depleted.
The G-Ratio Paradox and Energy Partition
The G-Ratio (the ratio of material removed to wheel wear) is the most common metric in published tool life data. A high G-ratio is typically marketed as superior. However, in a production environment, a high G-ratio can be a Deceptive Indicator. It often masks a wheel that is staying “too sharp” or “too dull” for the specific machine stiffness.
A high G-ratio achieved through excessive bond strength leads to a Mechanism where the wheel “glazes.” This glazing forces a higher percentage of energy into the workpiece (Rw). Consequently, while the wheel “lasts” a long time dimensionally, it produces parts with high Tensile Residual Stress. Relying solely on G-ratio data without correlating it to power-draw signatures is a primary cause of data failure in high-stakes manufacturing.
Equivalent Diameter (de) and Geometric Instability
As a grinding wheel wears, its diameter (ds) decreases, which fundamentally changes the Mechanism of the cut through the Equivalent Diameter (de). This geometric drift alters the Contact Length (lc) and the Uncut Chip Thickness (hcu).
Many published models assume a constant ds. In reality, as de shrinks, the grains must take a “deeper bite” to maintain the same removal rate, which increases the stress on each individual grain. This accelerates the Bond Fracture Mechanism near the end of the wheel’s life, causing the Cpk to drop precipitously. Failure to compensate for this non-linear wear rate is why predictive maintenance models based on static data often fail to prevent batch scrap.
The Life-cycle Axiom: “A grinding wheel is a living tool. Its life does not end when it disappears, but when its Mechanism of interaction with the part shifts from cutting to heating. Published data tracks the volume; the engineer must track the energy.”
5. Deterministic Dressing: Restoring Data Reliability
To bridge the gap between published life-cycle data and production reality, the most powerful lever available to the engineer is Deterministic Dressing. In a high-yield environment, dressing is no longer a reactive maintenance task; it is a precision Mechanism for “resetting” the wheel’s topography to a known state. By controlling the dressing kinematics, we can stabilize the Specific Grinding Energy (us), transforming the unpredictable drift of Cpk into a manageable, periodic cycle.
The Overlap Ratio (Ud) Mechanism
The most critical variable in stabilizing tool life data is the Overlap Ratio (Ud). This ratio defines how many times a single point on the dresser contacts the wheel surface during one pass. It is the primary Mechanism that dictates the “openness” of the wheel structure and, consequently, its cutting aggressiveness.
Where bd is the active width of the dresser, vs is the wheel speed, and vfd is the dressing feed rate. A low Ud (e.g., 2–4) creates a “rough” topography with high chip-storage capacity, lowering the thermal load but increasing wheel wear. Conversely, a high Ud (e.g., 6–8) “closes” the wheel, improving surface finish but drastically increasing the risk of Thermal Burn. Published data often fails because the dressing Mechanism used in the lab (low Ud) is not replicated on the shop floor, leading to a mismatch in energy partitioning.
Active Tool Topography and the Force Mechanism
Deterministic dressing allows for the creation of an Active Tool Topography that is tailored to the machine’s stiffness. When the dresser removes the worn, “glazed” layer of the wheel, it exposes fresh, sharp abrasive grains. This reset Mechanism ensures that the Normal Force (Fn) remains within the stable operating window of the spindle.
Without this deterministic control, the wheel’s sharpness drifts toward a state of Critical Dullness, where the force Mechanism shifts from cutting to elastic deformation. This transition is the leading cause of “ghost rejects”—parts that appear dimensionally correct but have failed NDT due to subsurface damage. High-yield production requires that the dressing interval be synchronized with the Abrasive Decay Model, ensuring that the Cpk of surface integrity is never compromised.
The Dresser Decay: Data Contamination
A often-overlooked factor in data reliability is the Mechanism of Dresser Wear. Just as the wheel wears, the diamond dresser itself undergoes mass loss and radius changes. As the dresser tip rounds off, the effective width (bd) in the Ud equation changes, inadvertently increasing the overlap ratio.
This “Data Contamination” causes the process to become hotter and more unstable over time, even if the CNC settings remain constant. To maintain a Zero-Defect Financial Model, engineers must implement Dresser Compensation, periodically recalibrating the dresser’s geometry. This ensures that the dressing Mechanism remains a constant, allowing the statistical models of tool life to remain accurate throughout the life of the wheel.
The Dressing Axiom: “Dressing is the heartbeat of data reliability in grinding. If you do not control the Mechanism of the dresser, you lose the ability to predict the Mechanism of the wheel. Consistency is not found in the abrasive; it is created by the diamond.”
6. Advanced Monitoring: Real-time Cpk Prediction
The ultimate evolution of data reliability in grinding is the transition from “Post-Process Inspection” to “In-Process Prediction.” Even with deterministic dressing, the inherent stochastic nature of abrasive grains introduces micro-variances. To maintain a true zero-defect yield, manufacturers must employ an Advanced Monitoring Mechanism that correlates real-time physical signals with the statistical process capability (Cpk).
Acoustic Emission (AE) and the Grain-Level Mechanism
Acoustic Emission (AE) sensors detect the high-frequency elastic waves generated during the material removal Mechanism. Unlike spindle power, which represents a macro-average of the energy consumed, AE signals provide a “high-resolution” view of individual grain interactions.
As the abrasive grains undergo Attritious Wear, the frequency spectrum of the AE signal shifts. A sharp wheel produces a specific “signature” associated with clean micro-cutting. When the wheel glazes, the signal intensity in the friction-dominated frequency bands increases. By monitoring the RMS (Root Mean Square) value of the AE signal, the system can predict the onset of thermal damage seconds before it occurs, effectively acting as a real-time guardian of the Cpk.
Spindle Power and Specific Energy Correlation
The Spindle Power Mechanism is the most reliable proxy for the Specific Grinding Energy (us). By integrating power sensors with the CNC, we can calculate the instantaneous energy flux at the contact zone.
A steady increase in Pnet during a batch is a direct indicator of wheel dulling. Modern Hybrid Prediction Models use this power data to adjust the Cpk forecast. If the power exceeds a calculated Thermal Threshold, the system triggers an emergency dressing cycle, overriding the pre-set interval. This dynamic adjustment is the only way to ensure 100% yield when dealing with raw material batches that have inconsistent metallurgical properties.
The Digital Twin Mechanism: Validating Tool Life
Data trust is further solidified through the Digital Twin Mechanism. By feeding real-time AE and power data into a physics-based simulation, the software creates a virtual mirror of the grinding wheel’s state. This twin calculates the Residual Stress Profile of the part in real-time, providing a “Virtual Inspection” that supplements physical measurement.
This Validation Mechanism closes the loop: the published lab data provides the starting point, the deterministic dressing provides the stability, and the real-time monitoring provides the final confirmation of reliability.
The Monitoring Axiom: “In the absence of feedback, data is merely a prophecy. In the presence of real-time monitoring, data becomes a Mechanism of certainty. To trust the yield, you must hear the process.”
7. ROI & Financial Model of High Capability
Investing in data reliability is often viewed by accounting departments as a “Cost Center.” However, a rigorous analysis of the Economic Mechanism of grinding proves the opposite. High process capability (Cpk) is the most significant driver of Return on Investment (ROI) in precision manufacturing. By synchronizing tool life data with production reality, organizations move from a reactive “Firefighting” mode to a proactive “Profit Generation” mode.
The Cost of Non-Conformance (CONC) Mechanism
The financial impact of unreliable data is best understood through the Cost of Non-Conformance (CONC). In grinding, the cost of a rejected part is at its maximum because it occurs at the final stage of the value chain.
When a batch is scrapped due to thermal burn—a failure of the Data Trust Mechanism—the company loses not just the raw material and the grinding time, but the “Opportunity Cost” of the preceding operations (turning, heat treatment, milling). A high-yield process anchored in reliable tool life models eliminates this waste, directly inflating the bottom line by reclaiming lost capacity.
The Yield-Leverage Effect on Abrasive Cost
There is a common Misconception Mechanism that minimizing wheel wear (maximizing G-ratio) is the best way to reduce costs. However, abrasive cost typically represents only 3–5% of the total part cost. In contrast, the Yield Rate accounts for over 20–30% of the cost structure in high-value components.
A strategy that uses a “softer,” more aggressive dressing Mechanism to ensure 100% surface integrity—even if it increases wheel consumption by 10%—will yield a significantly higher ROI. By prioritizing the Data Reliability of the part’s metallurgical state over the longevity of the tool, manufacturers protect the most expensive asset in the factory: the finished product.
Strategic Value and Brand Equity
Beyond the immediate shop floor metrics, the Mechanism of Brand Equity is reinforced by high process capability. Reliable data ensures that no “Latent Rejects” reach the customer. In aerospace and medical sectors, a single field failure can lead to catastrophic warranty claims and loss of contract.
A process with a verified Cpk of 1.67 or higher serves as a powerful marketing tool, allowing the organization to command premium pricing based on Certifiable Reliability. Data is not just a technical requirement; it is a financial fortress.
The Financial Axiom: “In the grinding gallery, you do not pay for the wheel you use; you pay for the parts you cannot sell. ROI is not found in the abrasive’s endurance, but in the Mechanism of process certainty.”
8. Conclusion: Quality as a Design Variable
As we have explored throughout this analysis, the journey from theoretical “Published Data” to actual “Production Yield” is paved with the understanding of physical Mechanisms. Data reliability in grinding is not a static property of an abrasive tool; it is a dynamic state achieved through the synchronization of machine rigidity, thermal management, and deterministic control. By moving beyond the simple observation of Cpk and diving into the Abrasive Physics that drives it, manufacturers can transform quality from a post-process hurdle into a proactive Design Variable.
The Synthesis of Trust
To restore trust in production data, the engineer must act as a bridge between the laboratory and the shop floor. This requires a three-tiered approach:
- Calibration: Adjusting catalog values using the Specific Energy Mechanism to account for the unique compliance of each machine.
- Stabilization: Implementing Deterministic Dressing to ensure the wheel’s topography is a constant, not a variable.
- Validation: Utilizing Real-time Monitoring (AE and Power) to confirm that the physical Mechanism is staying within the predicted statistical guardrails.
A Future Defined by Data Integrity
The future of high-yield manufacturing lies in the Digital-Physical Integration. As machine tools become more “aware” through sensor fusion, the gap between what we predict and what we produce will continue to narrow. However, the fundamental Mechanism of material removal remains governed by the laws of thermodynamics and mechanics. No amount of software can compensate for a thermally unstable process or a neglected dressing cycle.
In conclusion, achieving a Cpk that reflects true reliability requires more than just better measurements; it requires a culture of Data Integrity where every tool life estimate is validated against the physical reality of the contact zone. When we master the Mechanism, we master the yield.
The Ultimate Manufacturing Mantra
“Trust the physics, verify the data, and control the mechanism.
Only then does 100% yield become a predictable reality.”
References & Internal Technical Resources
Primary Engineering References
- • Malkin, S. & Guo, C. (2008). Grinding Technology: Theory and Applications of Machining with Abrasives. Industrial Press. (Focus: Specific Energy and Thermal Mechanisms).
- • Marinescu, I. D., Hitchiner, M., Uhlmann, E., Rowe, W. B., & Inasaki, I. (2013). Handbook of Machining with Grinding Wheels. CRC Press. (Focus: Wheel Wear and Dressing Kinematics).
- • Tawakoli, T. (1993). High Efficiency Deep Grinding (HEDG): Technology, Process Planning and Application. VDI-Verlag. (Focus: Advanced Material Removal Rates and ROI).
Internal Deep-Dive Series: Data Reliability & Process Optimization
To technically implement the deterministic dressing, real-time monitoring, and thermal stability strategies detailed in this report, please refer to the following core modules:
CORE MODULE:
Wheel Wear and Life-cycle Analysis: Deterministic Mechanisms and Predictive Modeling
CORE MODULE:
Dressing and Truing Mechanisms: Principles of Wheel Regeneration and Surface Generation
STRATEGIC INSIGHT:
Process Capability (Cp, Cpk) in Grinding: Why Surface Integrity Matters for Yield
INTELLIGENT SENSING 32:
Sensor-Based Grinding Monitoring: Cost vs Benefit Analysis