1. The Anatomy of a Finished Surface: Diagnosis and Classification
In precision grinding, achieving the target Surface Roughness (Ra) is not merely an aesthetic requirement but a functional necessity. A surface that is too “rough” can lead to premature fatigue failure, while a surface that is too “smooth” may fail to retain essential lubrication films. When Ra values deviate from the specification, the engineer must first determine if the failure is Periodic (caused by machine kinematics) or Stochastic (caused by random abrasive interaction).
In my years of working with precision grinding on real shop floors, I’ve learned that a surface roughness number on paper rarely tells the full story — it’s the symptoms and anomalies we see day after day that guide the real diagnosis.
Understanding the Metrics: Ra vs. Rz
While Ra (Arithmetic Average) is the industry standard, it often masks critical surface defects. A surface can have an acceptable Ra but a catastrophic Rz (Maximum Peak-to-Valley Height). In troubleshooting, a high Rz/Ra ratio usually points toward individual “rogue” grains or poor coolant filtration, whereas a high Ra with a consistent profile suggests an issue with the dressing lead or the feed-to-speed ratio.
Visual Classification of Surface Failures
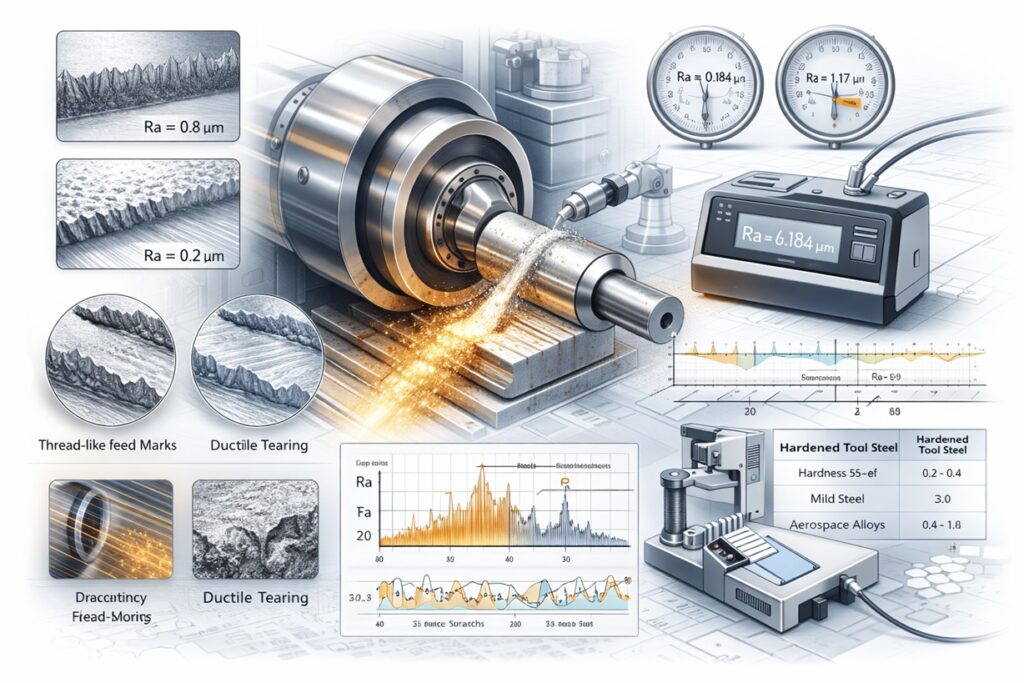
Before looking at the machine controller, the surface topography should be inspected for the following characteristic signatures:
- • Thread-like Feed Marks: Visible helical patterns indicating the dressing lead is too aggressive or the traverse speed is unsynchronized.
- • Surface Tearing (Ductile Fracture): A “plucked” appearance where the metal has been torn rather than cut, often due to poor lubrication.
- • Random Scratches (Comet Tails): Deep, isolated furrows usually caused by swarf recirculation or a breaking wheel bond.
Identifying these symptoms allows the engineer to isolate the root cause. If the surface shows a “clean” but rough profile, the issue is likely Kinematic. If the surface appears damaged or irregular, the issue is Stochastic or Environmental. By establishing this diagnostic baseline, we can now apply the mathematical models that govern the geometric footprint of the abrasive grains.
2. The Kinematic Footprint: The Geometry of Surface Generation
The geometric finish of a ground surface is defined by the series of “trajectories” left by the abrasive grains as they sweep across the workpiece. This is known as Geometric Roughness, and it represents the theoretical lower limit of the process, calculated based on speeds and feeds, independent of machine vibrations or wheel wear. If the actual measured Ra is significantly higher than this theoretical value, it indicates a fundamental imbalance in the process parameters.
Theoretical Roughness Modeling
The primary geometric drivers of surface finish are the wheel radius (Rs) and the feed rate per revolution (f). This relationship demonstrates that the feed rate has a squared-proportional impact on the resulting roughness, meaning even small increases in feed can drastically degrade surface quality.
Theoretical Roughness (Peak-to-Valley) Calculation
Rt, theory ≈ f2 / (32 × Rs)
Impact of Undeformed Chip Thickness (hcu)
Beyond simple feed rates, the Maximum Undeformed Chip Thickness (hcu) dictates the depth to which an individual grain penetrates the workpiece. As hcu increases, so does the cutting force and the grain’s penetration depth, resulting in a rougher topography.
- • Increasing Wheel Speed (vs): Effectively reduces hcu, leading to a finer surface finish.
- • Decreasing Work Speed (vw): Reduces the material volume per grain, improving the Ra.
The Velocity Ratio (qs) Impact
In the field, controlling the Velocity Ratio (qs = vs / vw) is the most efficient way to manage finish. Generally, a higher qs (faster wheel, slower work) results in a smoother surface. However, this ratio must be balanced against the risk of Grinding Burn, as excessively high ratios generate higher friction and heat.
While kinematic models assume a perfect wheel condition, real-world grinding is dominated by the topography created during Dressing. Having established the geometric footprint, we can now move to the primary control lever of the process.
3. The Dressing DNA: The Master Control of Topography
While kinematics set the theoretical limits, Dressing determines the actual density of active cutting edges (C) on the wheel surface. In 80% of industrial cases, surface roughness failures are not caused by the wheel or the machine, but by an improper Dressing Lead or Overlap Ratio. Dressing effectively “writes” the DNA of the surface finish onto the wheel face.
From hands-on experience, the dressing setup is where theory meets reality: even a well-designed model can fall short if the wheel was dressed without a clear intent of the finish requirement.
The Overlap Ratio (Ud)
The most critical metric for a dressing engineer is the Overlap Ratio (Ud). This represents how many times a single point on the wheel face is contacted by the diamond dresser during a cycle. If Ud is too low, the wheel remains “sharp” but creates a rough, threaded finish. If Ud is too high, the wheel becomes “crushed” or glazed, leading to low roughness but high thermal risk.
Dressing Overlap Ratio Calculation
Ud = bd / fd
Dressing Lead vs. Ra Sensitivity
Surface roughness is highly sensitive to the dressing lead (fd). As a rule of thumb, the surface roughness increases by approximately the square root of the increase in dressing lead. If you double the dressing lead, you can expect the Ra to increase by about 40%. Engineers must use this relationship to “fine-tune” the wheel’s sharpness to match the required finish.
Dressing Depth (aed) and Fracture Mechanics
Beyond the lead, the Dressing Depth determines how many abrasive grains are fractured. If the dressing depth is too shallow (e.g., < 5 μm), the diamond may only “rub” the grains, creating flats that lead to glazed finishes. A proper dressing depth (typically 10–30 μm) ensures that blunt grains are fully removed, leaving a fresh, sharp topography that produces a consistent, albeit slightly rougher, Ra.
Dressing allows us to manipulate the wheel’s surface, but the underlying abrasive chemistry provides the material foundation. In the next section, we look beyond the “cut” and into the “grit” to see how abrasive selection influences the stochastic nature of surface generation.
4. Beyond Geometry: Stochastic Factors and Abrasive Science
Even with perfect kinematics and dressing, surface roughness is influenced by the Stochastic (random) nature of the grinding wheel. Unlike a single-point turning tool, a grinding wheel consists of thousands of randomly oriented grains. The statistical distribution of these Active Cutting Edges (Ca) determines the high-frequency components of the surface profile.
Grit Size Dynamics and Abrasive Density
The most obvious lever for roughness control is the Abrasive Grit Size. According to the average grain load model, finer grits increase the number of active edges per square millimeter. This reduces the individual Grain Depth of Cut (gmax), leading to a shallower “scratch” on the workpiece. However, finer grits also reduce the pore space available for chip clearance, increasing the risk of loading.
Chemical Interaction: Al2O3 vs. CBN
Abrasive chemistry plays a subtle but vital role in surface integrity. Aluminum Oxide (Al2O3) grains are prone to micro-fracturing, which can keep the wheel sharp but lead to inconsistent Rz values. Cubic Boron Nitride (CBN), on the other hand, maintains its sharp edges for much longer due to its extreme hardness and thermal stability, often producing a more “uniform” surface finish over long production runs compared to conventional abrasives.
The “Tearing” Phenomenon in Ductile Materials
When grinding soft, ductile materials (like mild steel or aluminum), the abrasive grains may fail to shear the material cleanly. Instead, the metal “smears” or “tears,” leading to a ragged surface finish regardless of the grit size. This transition from Brittle Flow to Ductile Tearing is often the result of chemical affinity between the grit and the workpiece, where the material “welds” to the grain tip.
While abrasive choice provides the potential for a fine finish, the environment in which the cut occurs—specifically the cooling and lubrication—determines whether that potential is realized. In the next section, we examine the critical threshold where lubrication prevents surface tearing.
5. The Cooling & Lubrication Threshold: Preventing Surface Tearing
Even with a perfectly dressed fine-grit wheel, surface finish can collapse if the Metalworking Fluid (MWF) fails to maintain a stable film at the grinding interface. In the high-pressure environment of the “grinding zone,” the fluid’s primary role is to reduce the friction between the bond/grit and the workpiece. If this lubrication threshold is breached, the process transitions from clean shearing to Adhesive Tearing.
Lubrication vs. Surface “Plucking”
When lubrication is insufficient, the abrasive grains exert excessive tangential force, causing the workpiece material to deform plastically and “weld” to the grain tips. As the wheel continues to rotate, these micro-welds are violently torn apart, leaving a ragged, “plucked” topography. This phenomenon drastically increases Rz values and is often mistaken for a wheel that is too “coarse.”
The Impact of Filtration and SWARF Recirculation
The cleanest wheel in the world cannot produce a mirror finish if it is being fed “dirty” coolant. Recirculated grinding chips (swarf) act as rogue abrasive particles that are dragged through the contact zone, creating deep, random Linear Scratches (often called “comet tails”). For high-precision finishes (< 0.2 μm Ra), a filtration system capable of removing particles down to 5 μm is mandatory.
📋 Coolant Health Checklist for Roughness Control
- • Concentration Levels: Maintain 7–10% for oil-in-water emulsions to ensure sufficient ester/oil content for lubrication.
- • Jet Velocity: Match coolant exit velocity to 100% of the wheel speed to break the “air barrier” and ensure fluid enters the cut.
- • Temperature Stability: Fluctuations in coolant temperature cause thermal expansion of the workpiece, leading to “waviness” rather than micro-roughness.
Environmental factors provide the stability needed for a clean cut, but the “polishing” of the surface occurs in the final seconds of the cycle. By managing the pressure and contact time during the Spark-out phase, we can systematically drive the roughness down to its absolute physical minimum.
6. Practical Synthesis: The Spark-out Strategy and Pressure Depletion
The most effective way to improve surface finish without changing wheels or dressing parameters is the optimization of the Spark-out Phase. During this final stage of the grinding cycle, the feed is stopped, and the wheel continues to rotate against the workpiece. This process utilizes the residual System Deflection to perform micro-level material removal, effectively “polishing” the peaks left by the roughing pass.
The Mechanics of Force Depletion
During the roughing pass, the grinding system (spindle, wheel, and fixture) deflects due to the normal force (Fn). When the feed stops, this “stored” energy is released as the system relaxes. The normal force decays exponentially, and as Fn drops, the individual Grain Depth of Cut approaches zero. This is where the transition from “cutting” to “plowing/rubbing” occurs, which is essential for achieving ultra-fine Ra values.
Calculating the Optimum Spark-out Time
If the spark-out time is too short, the residual force remains high, leaving a rough finish. If it is too long, the grains may “rub” the surface, causing localized heat buildup and potential glazing. The time required for the force to decay is governed by the System Time Constant (τ), which is the ratio of system stiffness (ksys) to the grinding stiffness (kg).
Exponential Force Decay Model
Fn(t) = Fn,0 ⋅ e–t/τ
By mastering the spark-out phase, the operator can compensate for a coarser wheel or a faster roughing pass, maintaining high productivity while ensuring the final microns are removed under ultra-low pressure. This synthesis of theory and practice allows for a final troubleshooting review to ensure all variables are aligned for a “mirror” finish.
7. Advanced Diagnostics: Prioritized Troubleshooting Matrix
When surface roughness fails on the shop floor, the pressure for a rapid resolution often leads to “knob-turning”—randomly changing parameters without a systematic plan. To achieve Deterministic Surface Quality, the engineer must follow a prioritized diagnostic hierarchy. This final section provides a synthesis of all previous principles into an actionable troubleshooting matrix.
The “Rule of Three” for Rapid Adjustment
If the Ra is suddenly out of tolerance, follow these three steps in order:
1. Verify the Dressing Overlap: Is the diamond worn? A flattened diamond increases the effective contact width (bd), inadvertently increasing the overlap ratio and potentially glazing the wheel.
2. Check the Spark-out Count: Ensure the system is actually reaching zero-force. An extra two revolutions of spark-out can often resolve a 0.1 μm Ra deviation.
3. Analyze the Coolant Delivery: Is the nozzle aimed at the contact zone or just splashing the wheel? Ensure the “air barrier” is being broken.
In practice, the best engineers I’ve worked with don’t rush to twist knobs; they observe, record, and test one variable at a time — because consistent finishes come from disciplined adjustments, not guesswork.
Root Cause & Resolution Matrix
Use the following table to match specific surface symptoms with the most likely mechanical or kinematic cause:
Final Conclusion: The Path to Mirror Finishes
Achieving superior surface finishes in grinding is a science of balance. By understanding the Kinematic footprint, mastering the Dressing DNA, and ensuring the stability of the Lubrication threshold, the transition from roughing to mirror finishing becomes a predictable, repeatable process. In the next era of precision manufacturing, the integration of real-time surface profilometry will allow these adjustments to happen autonomously, further cementing the role of grinding as the ultimate finishing operation.
The Master Formula for Roughness Control
Correct Dressing Lead + Proper Spark-out + Clean Coolant = Optimal Surface Integrity
References & Further Reading
Technical Publications & Industrial Standards
- • Malkin, S., & Guo, C. (2008). Grinding Technology: Theory and Applications of Machining with Abrasives. Industrial Press. (Focus: Surface finish modeling and grit-workpiece interaction).
- • Shaw, M. C. (1996). Principles of Abrasive Processing. Oxford University Press. (Focus: Kinematic influence on topography and micro-cutting mechanics).
- • Tonshoff, H. K., et al. (1992). Dressing and Truing of Grinding Wheels. CIRP Annals. (Focus: Mathematical modeling of dressing lead and overlap ratios).
Curated Internal Resources: Surface Excellence Series
To achieve deterministic control over surface quality and minimize subsurface defects, explore our specialized deep-dives:
PREDICTIVE MODELING:
Surface Roughness Generation Modeling: Deterministic Mechanisms for Geometric Interference, Plastic Flow, and Dynamic Stability in Precision Grinding
INTEGRITY ANALYSIS:
Analysis of Sub-surface Damage: A Deterministic Evaluation of Damage Depth and Its Impact on Surface Integrity
Industrial Research Institutions
- CIRP: Research on surface integrity and advanced characterization of ground components.
- NIST Manufacturing Engineering: Standards for surface texture measurement and profilometry calibration.
© 2026 Advanced Machining Intelligence | Strategic Resource for Surface Roughness Optimization and Process Control